
Solana (SOL) took a nosedive of 9.5% on Wednesday, dropping from $205 to $186. And guess what? It’s potentially forming a bearish engulfing pattern on the daily chart. A close below $190 would mark its most significant daily loss since March 3, when SOL plunged over 20%. But let’s not jump to conclusions just yet!
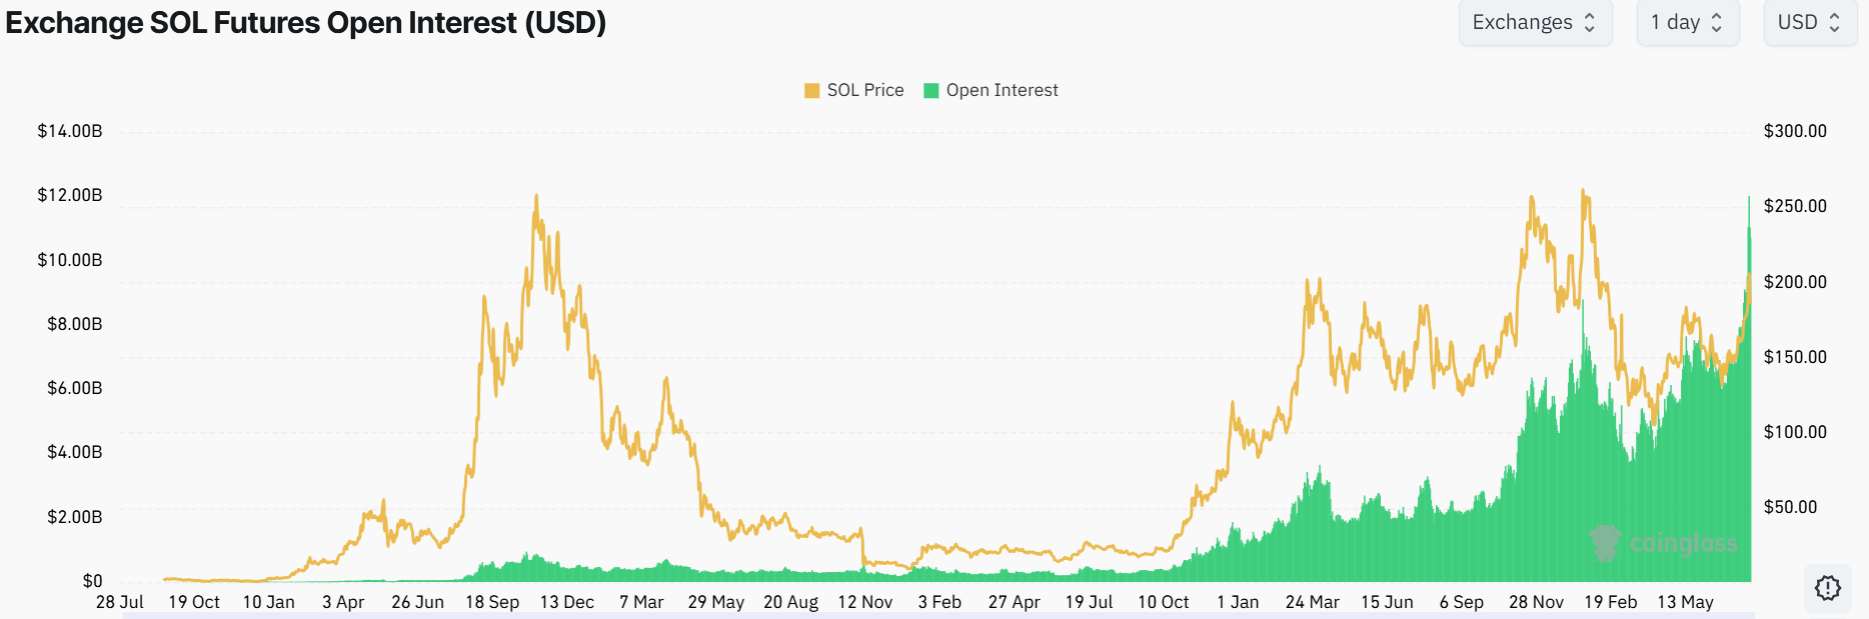
The futures market wasn’t much kinder. A cool $30 million in long positions were liquidated after SOL's open interest (OI) hit an eye-popping all-time high of $12 billion. Although SOL is still sitting 36% below its all-time high, the elevated OI suggests traders may be unwinding long positions and cashing in on some sweet profits.
On-Chain Indicators Point to a Potential Correction
On-chain indicators were also waving red flags. Net taker volume turned decidedly sell-heavy, signaling that more aggressive traders were taking the sell side. And if you look closely, the aggregated spot cumulative volume delta (CVD) started dropping, a signal that buyers were likely cashing out around the $200 level. Oh, and the aggregated futures CVD was steadily declining while prices were rising, a classic bearish divergence right before the drop. Not the best sign, huh?

And it gets juicier. Funding rates hit their highest point in the past quarter, which is like a flashing neon sign saying, "Hey, long trades are overcrowded!" Combine that with the elevated OI, and boom, you've got the perfect setup for a long squeeze. Over-leveraged traders had no choice but to bail under pressure.
Is This the Dip to Buy?
So, the million-dollar question: Is this the dip to buy?
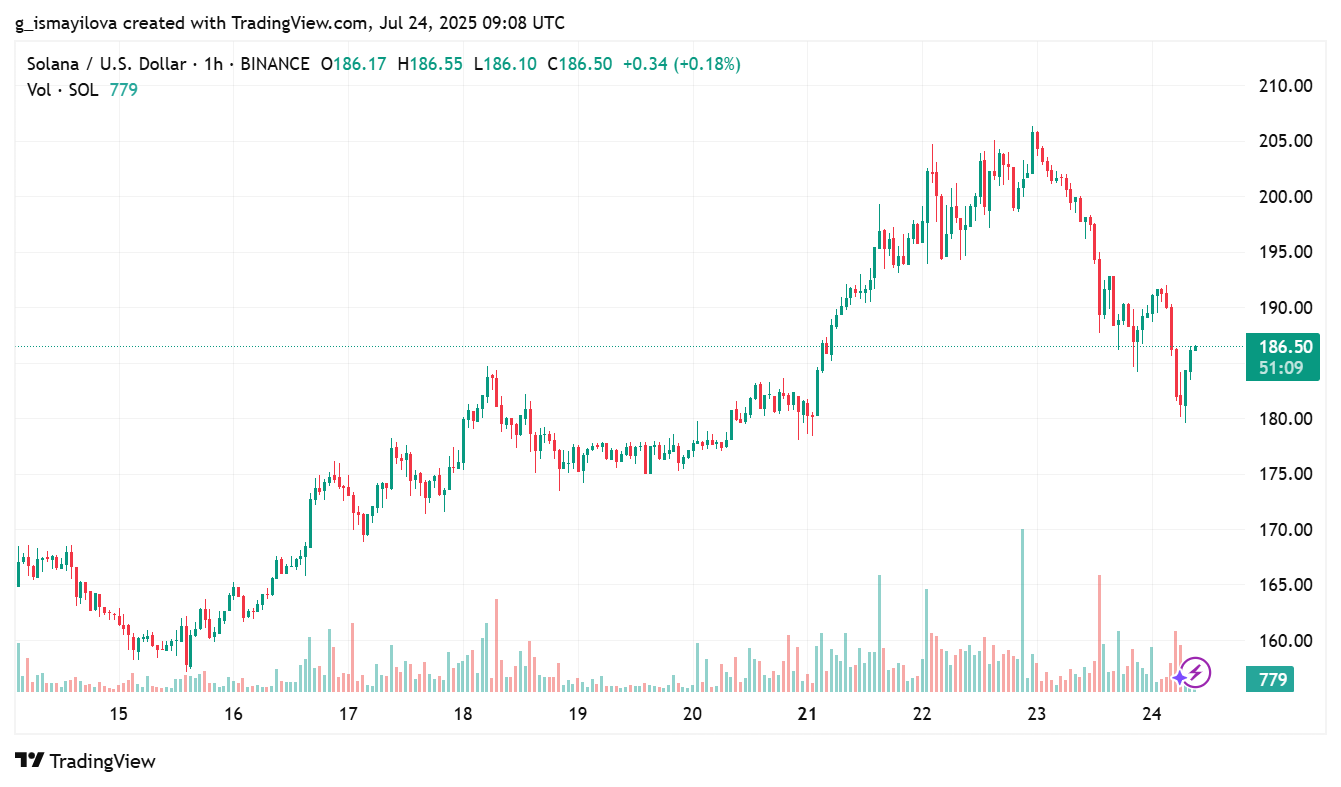
Well, while the 9% drop might be worrying in the short term, it’s important to remember that SOL had just rocketed 56% in the last 30 days. A pullback after such aggressive upward movement isn’t unusual, and sometimes it’s just the market hitting the reset button. Technically speaking, the daily chart still looks pretty solid, with $180 emerging as the key support for a bullish continuation.
SOL made a big move earlier this week by reclaiming the $180 level, breaking through a bullish structure (BOS) and triggering a golden cross between the 50-day and 200-day EMAs. Last time that happened, SOL shot up over 730% between October 2023 and March 2024. Yep, you read that right: 730%. That’s some serious juice.
If SOL holds support around $180, bullish momentum could continue. But if it falls through, we could be looking at a deeper correction, potentially towards the $168–$157 zone. This range aligns with a daily fair value gap, an area of prior market imbalance, and the 0.5–0.618 Fibonacci retracement levels. In other words, it’s a high-probability technical retest zone.
So If Solana can hold onto the $180 support, we might just see another bullish rally. If not, it might be time for an intense ride down. The decision is yours!
Disclaimer: All materials on this site are for informational purposes only. None of the material should be interpreted as investment advice. Please note that despite the nature of much of the material created and hosted on this website, HODL FM is not a financial reference resource, and the opinions of authors and other contributors are their own and should not be taken as financial advice. If you require advice. HODL FM strongly recommends contacting a qualified industry professional.