
Welcome to HODL FM’s weekly coin analysis, where we pick a top-performing cryptocurrency over the last 7 days and assess its technical, fundamental, and on-chain metrics.
Related: XRP Rises from the Ashes and Becomes 4th Largest Crypto
This week, XRP recovered from the $0.4700 and $0.4500 levels after spending almost 2-weeks within the price region. Now, the cryptocurrency is trading at $0.49310 (11:33 UTC) after it broke the $0.5000 psychological resistance on Monday, June 17, and tested a weekly high of $0.5200 on the same day.

Despite a slight correction to the $0.4900 mark, XRP is watching out for a recovery in the upcoming days once its support gains accumulation from whale wallet holders. If this happens, bulls aim to recover their recent losses and retest the $0.5400 region.
Institutional Investments Are Driving XRP’s Price
The recent price increase on Ripple is largely driven by institutional investors. These investors demonstrated their confidence in XRP after they poured $1.1M+ into the altcoin. This was a large investment compared to Chainlink, Litecoin, and Solana, which received total inflows worth $1 million.
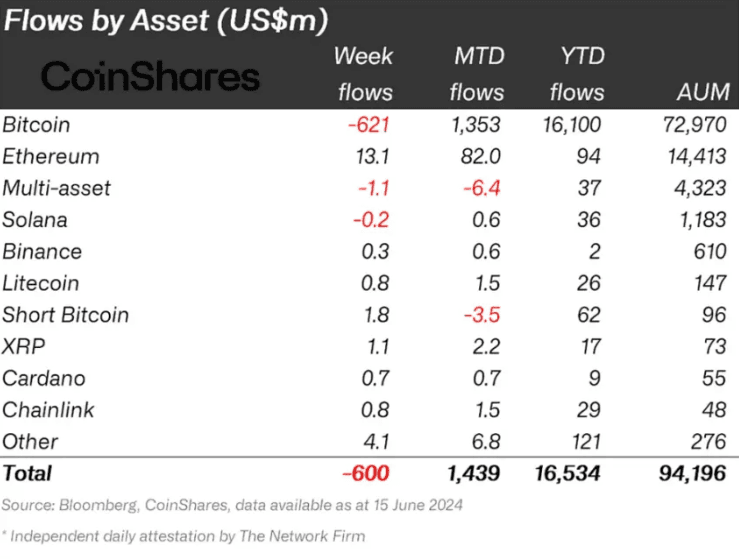
The investment comes against the backdrop of the Federal Open Market Committee’s hawkish fiscal policy. As such, XRP has illustrated the strong confidence it has won among large institutional investors.
XRP/USD Technical Analysis
The current technical indicators present a mixed but cautiously bearish outlook for the market. The Relative Strength Index (RSI) is currently at 54 points, indicating a neutral stance but with a slight bullish tilt. The RSI yellow line is trending upwards after intersecting with the blue line. This suggests a potential increase in buying momentum.
Meanwhile, the Moving Average Convergence Divergence (MACD) indicator shows a series of short green bars on Monday, some parts of Tuesday, and today, indicating brief periods of bullish activity. However, short red bars have replaced this bullish momentum on the daily chart, signaling a potential shift to bearish sentiment. Thank heaven, the 1-hour chart (as of this writing) is showing the start of green bars, which suggests the beginning of a recovery.
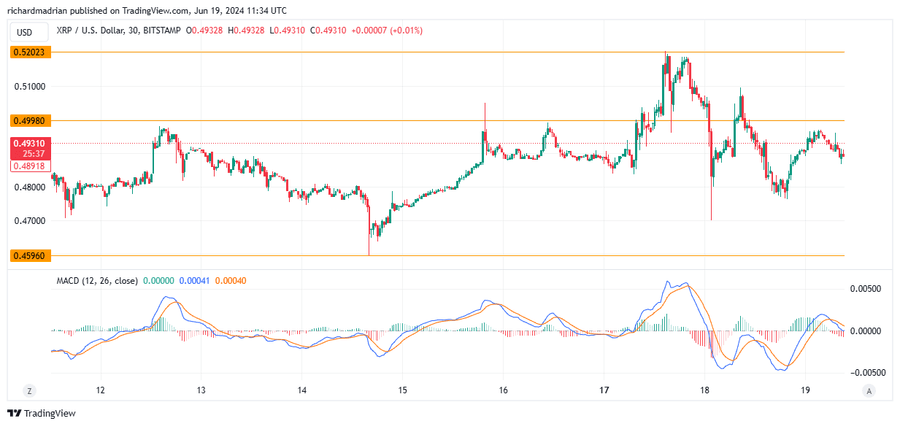
The MACD’s blue line crossed the orange line from above today, having spent most of yesterday above it, which generally indicates a bearish crossover. Currently, the lines are nearly intersecting at the +0.00048 level, reflecting a possible convergence and signaling indecision in the market. This confluence of signals suggests that traders should exercise caution, as the market may be gearing up for a downside, but if institutional investors come in as suggested by on-chain indicators, the price of XRP could be headed for an uptrend.
Final Take
If the bulls can secure 50 points on the RSI, this would confirm a bullish momentum for the price of XRP. Incase the indicator maintains around this position, this suggests sustained buyer interest that could lead to a continuation of XRP’s recent bullish momentum. After all, the technical confirmation will boost confidence among institutional and retail traders who are strongly optimistic about Ripple’s long-term prospects.
More Info:
Disclaimer: All materials on this site are for informational purposes only. None of the material should be interpreted as investment advice. Please note that despite the nature of much of the material created and hosted on this website, HODL FM is not a financial reference resource and the opinions of authors and other contributors are their own and should not be taken as financial advice. If you require advice of this sort, HODL FM strongly recommends contacting a qualified industry professional.