

Welcome to another HODL FM Tuesday, that moment of the week when our readers take 3 minutes to digest Bitcoin’s short-term and medium-term performance.
Here is what we covered today:
- Bitcoin’s recent performance inside the no man’s land
- Short-term forecasts based on accumulation and re-accumulation
- The 20-day exponential moving average (Minor resistance)
- The 50-day simple moving average (Major resistance)

Bitcoin’s Accumulation and Re-accumulation Phase
No Man’s Land in Bitcoin technical analysis can denote the in-between zone during pre-halving and post-halving. Traders often perceive this as a danger zone for two reasons.
- The trend is usually range-bound with traders uncertain about the next big move.
- Bullish traders may step to the sidelines, accumulation comes to a halt, and worse the bears could take over the market resulting in a sharp drop.
To tackle market uncertainty of the no man’s land and make it more habitable for hodlers, analysts have pointed out that a consolidation near a lifetime high in a range-bound market is perceived as a positive signal. However, failure to break above the overhead resistance after multiple attempts may exhaust traders and make them dump their positions. The silver lining of the range-bound trend is it allows people like us who love HODLING to keep on accumulating, and perhaps defend crucial support levels.

Looking at the price charts, Bitcoin must have marked its potential post-halving bottom on 1st May at $56,800. If this is not the case, the current price pullback after the halving event will go down the books of technical analysis as the longest retrace that happened for 63+ days, according to Rekkt Capital. Per historical performance, this pullback came to a halt on the 47th day, and now Bitcoin is out of the danger zone into the re-accumulation phase.
As of this writing, BTC is exchanging hands at $63,000. While it continues strengthening above the $60,000 psychological support, sell-side pressure is slowing down and attracting more buyers to continue accumulating in anticipation of an upward momentum beyond the all-time high.
20-day EMA Vs the 50-day SMA on Bitcoin Weekly Price Movements
However, this is not to say there is no evidence of bears on the weekly chart. When you look closely at the 20-day Exponential Moving Average (EMA), the bulls are struggling to sustain it above $62,671, which indicates that sellers still have some pressure on the current market situation.
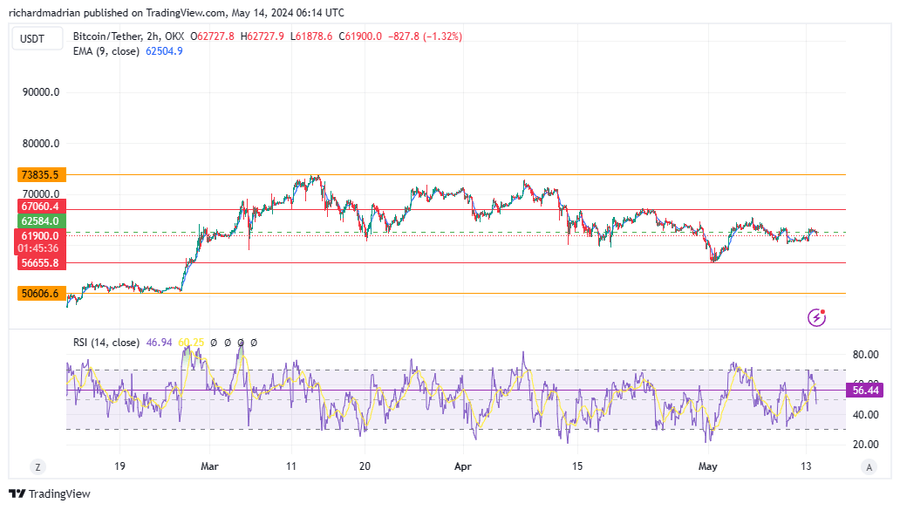
Then there is the Relative Strength Index at 56 points from yesterday’s mid-point, which suggests there is an improvement in Bitcoin’s upward momentum as the bulls attempt to break out of the 20-day EMA unto the 50-day Simple Moving Average (SMA) at $65,426. As highlighted in the chart above, this is the next resistance level and could be a bit stiff for the buyers to surpass it, if they do break above it, they have a higher chance of breaking above $70,000 in the upcoming days.

At the look of things as of this writing, it is pretty impossible for anyone to put their fingers on what direction Bitcoin will move. Will it head towards the 50-day SMA and break above the major support at $67,000 or will it turn back and decline to the critical support zone between $56,500 and $59,600?
Disclaimer: All materials on this site are for informational purposes only. None of the material should be interpreted as investment advice. Please note that despite the nature of much of the material created and hosted on this website, HODL FM is not a financial reference resource and the opinions of authors and other contributors are their own and should not be taken as financial advice. If you require advice of this sort, HODL FM strongly recommends contacting a qualified industry professional.