

XRP, the third-largest cryptocurrency by market cap, is making waves, currently trading at $2.90, up 18% in the last 3 months and 63% higher than its year-to-date low. With a market cap of $173.8 billion and a daily trading volume of $6.4 billion, things were looking pretty sweet for XRP. But hold your horses!
Much of XRP’s impressive performance can be credited to the legal victory Ripple, the company behind XRP, scored in its lengthy battle with the U.S. Securities and Exchange Commission (SEC). Oh, and the hype surrounding the upcoming launch of a spot XRP ETF is fueling anticipation, with hopes that institutional demand could soon flood in.
Signs of a Potential Correction
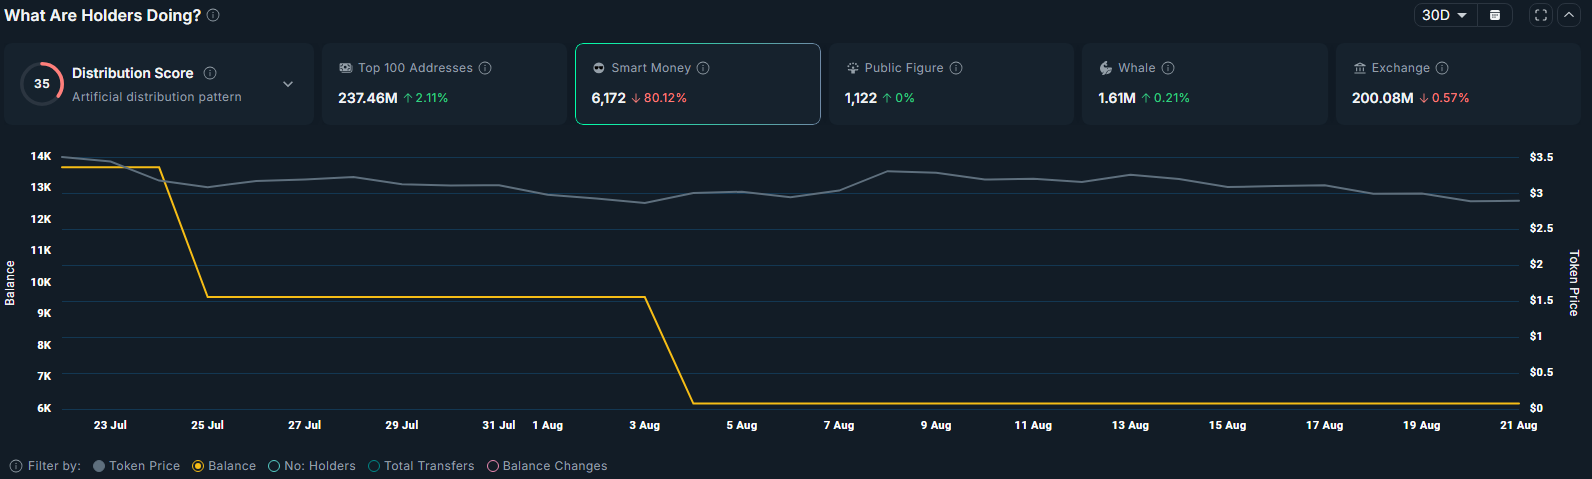
But not everything is sunshine and rainbows. Despite the year’s gains, the XRP price has dropped 16.8% in the last month, showing signs of a potential correction. According to Nansen, smart money investors have slashed their XRP holdings by 80% in the past 30 days, which is usually a red flag. When big investors pull back, retail investors often follow suit, amplifying the price decline.
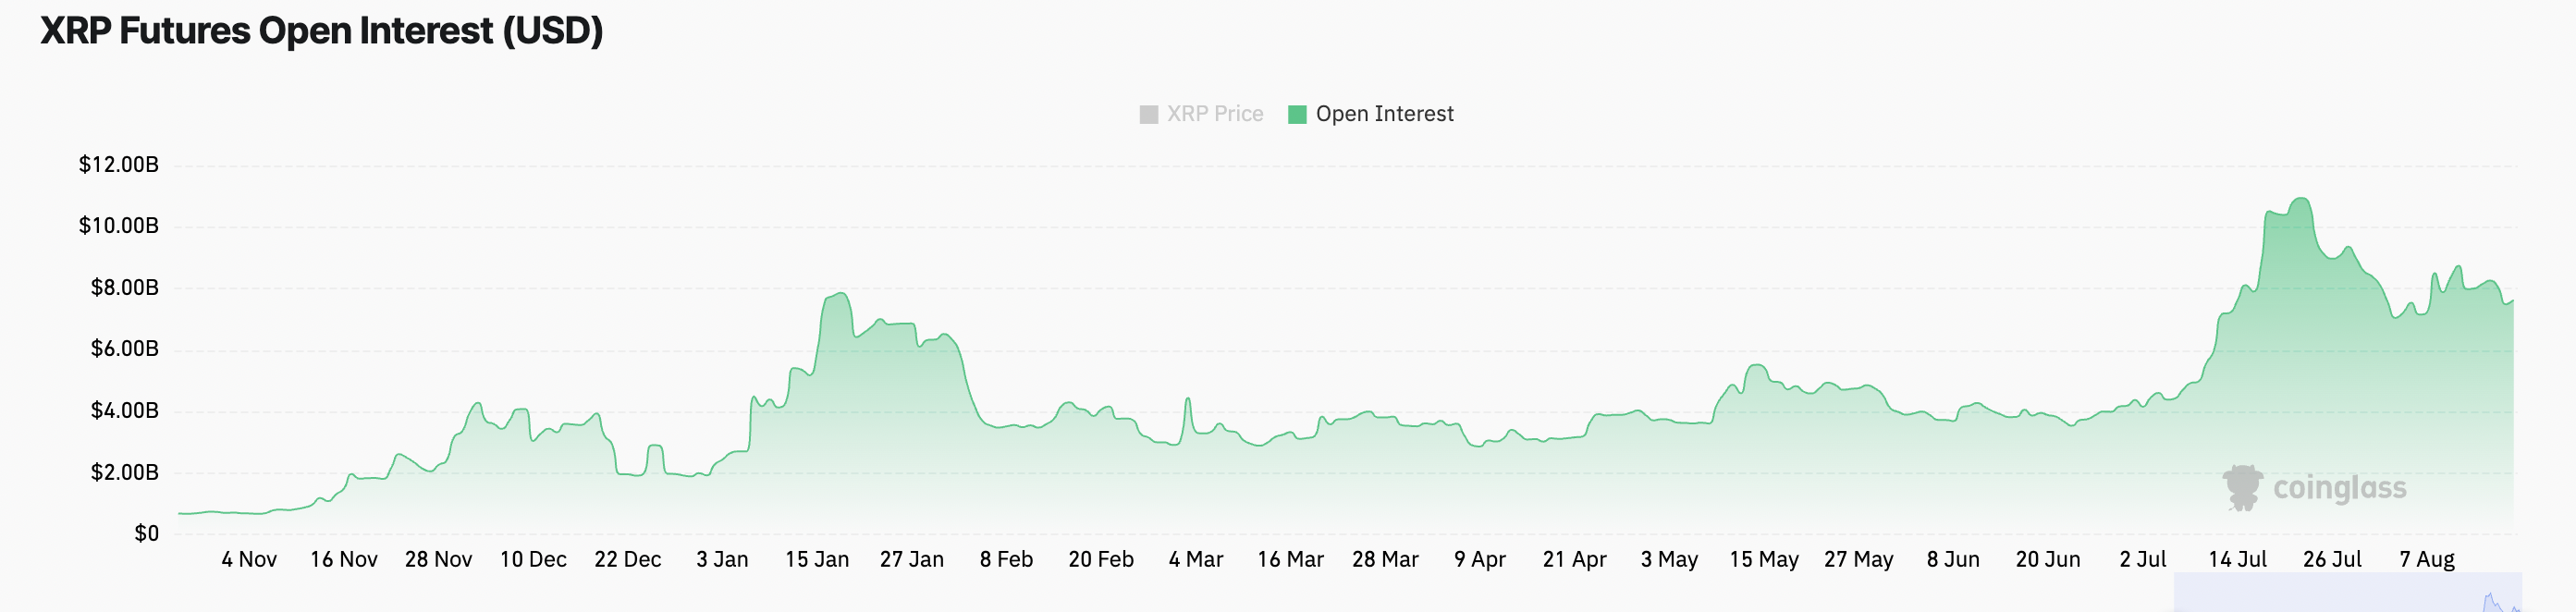
Futures traders are also feeling bearish. Data from CoinGlass shows a significant drop in open interest for XRP futures from $10.94 billion in July to $7.54 billion now. Even more telling, the long/short ratio is below 1, indicating more traders are betting on a downturn.
Adding fuel to the bearish fire, activity on the XRP Ledger has slowed. Weekly transactions have dropped by 14.8%, and weekly active addresses fell by 2.1%. It’s hard to ignore these signs of weakening network demand.
XRP Price Analysis
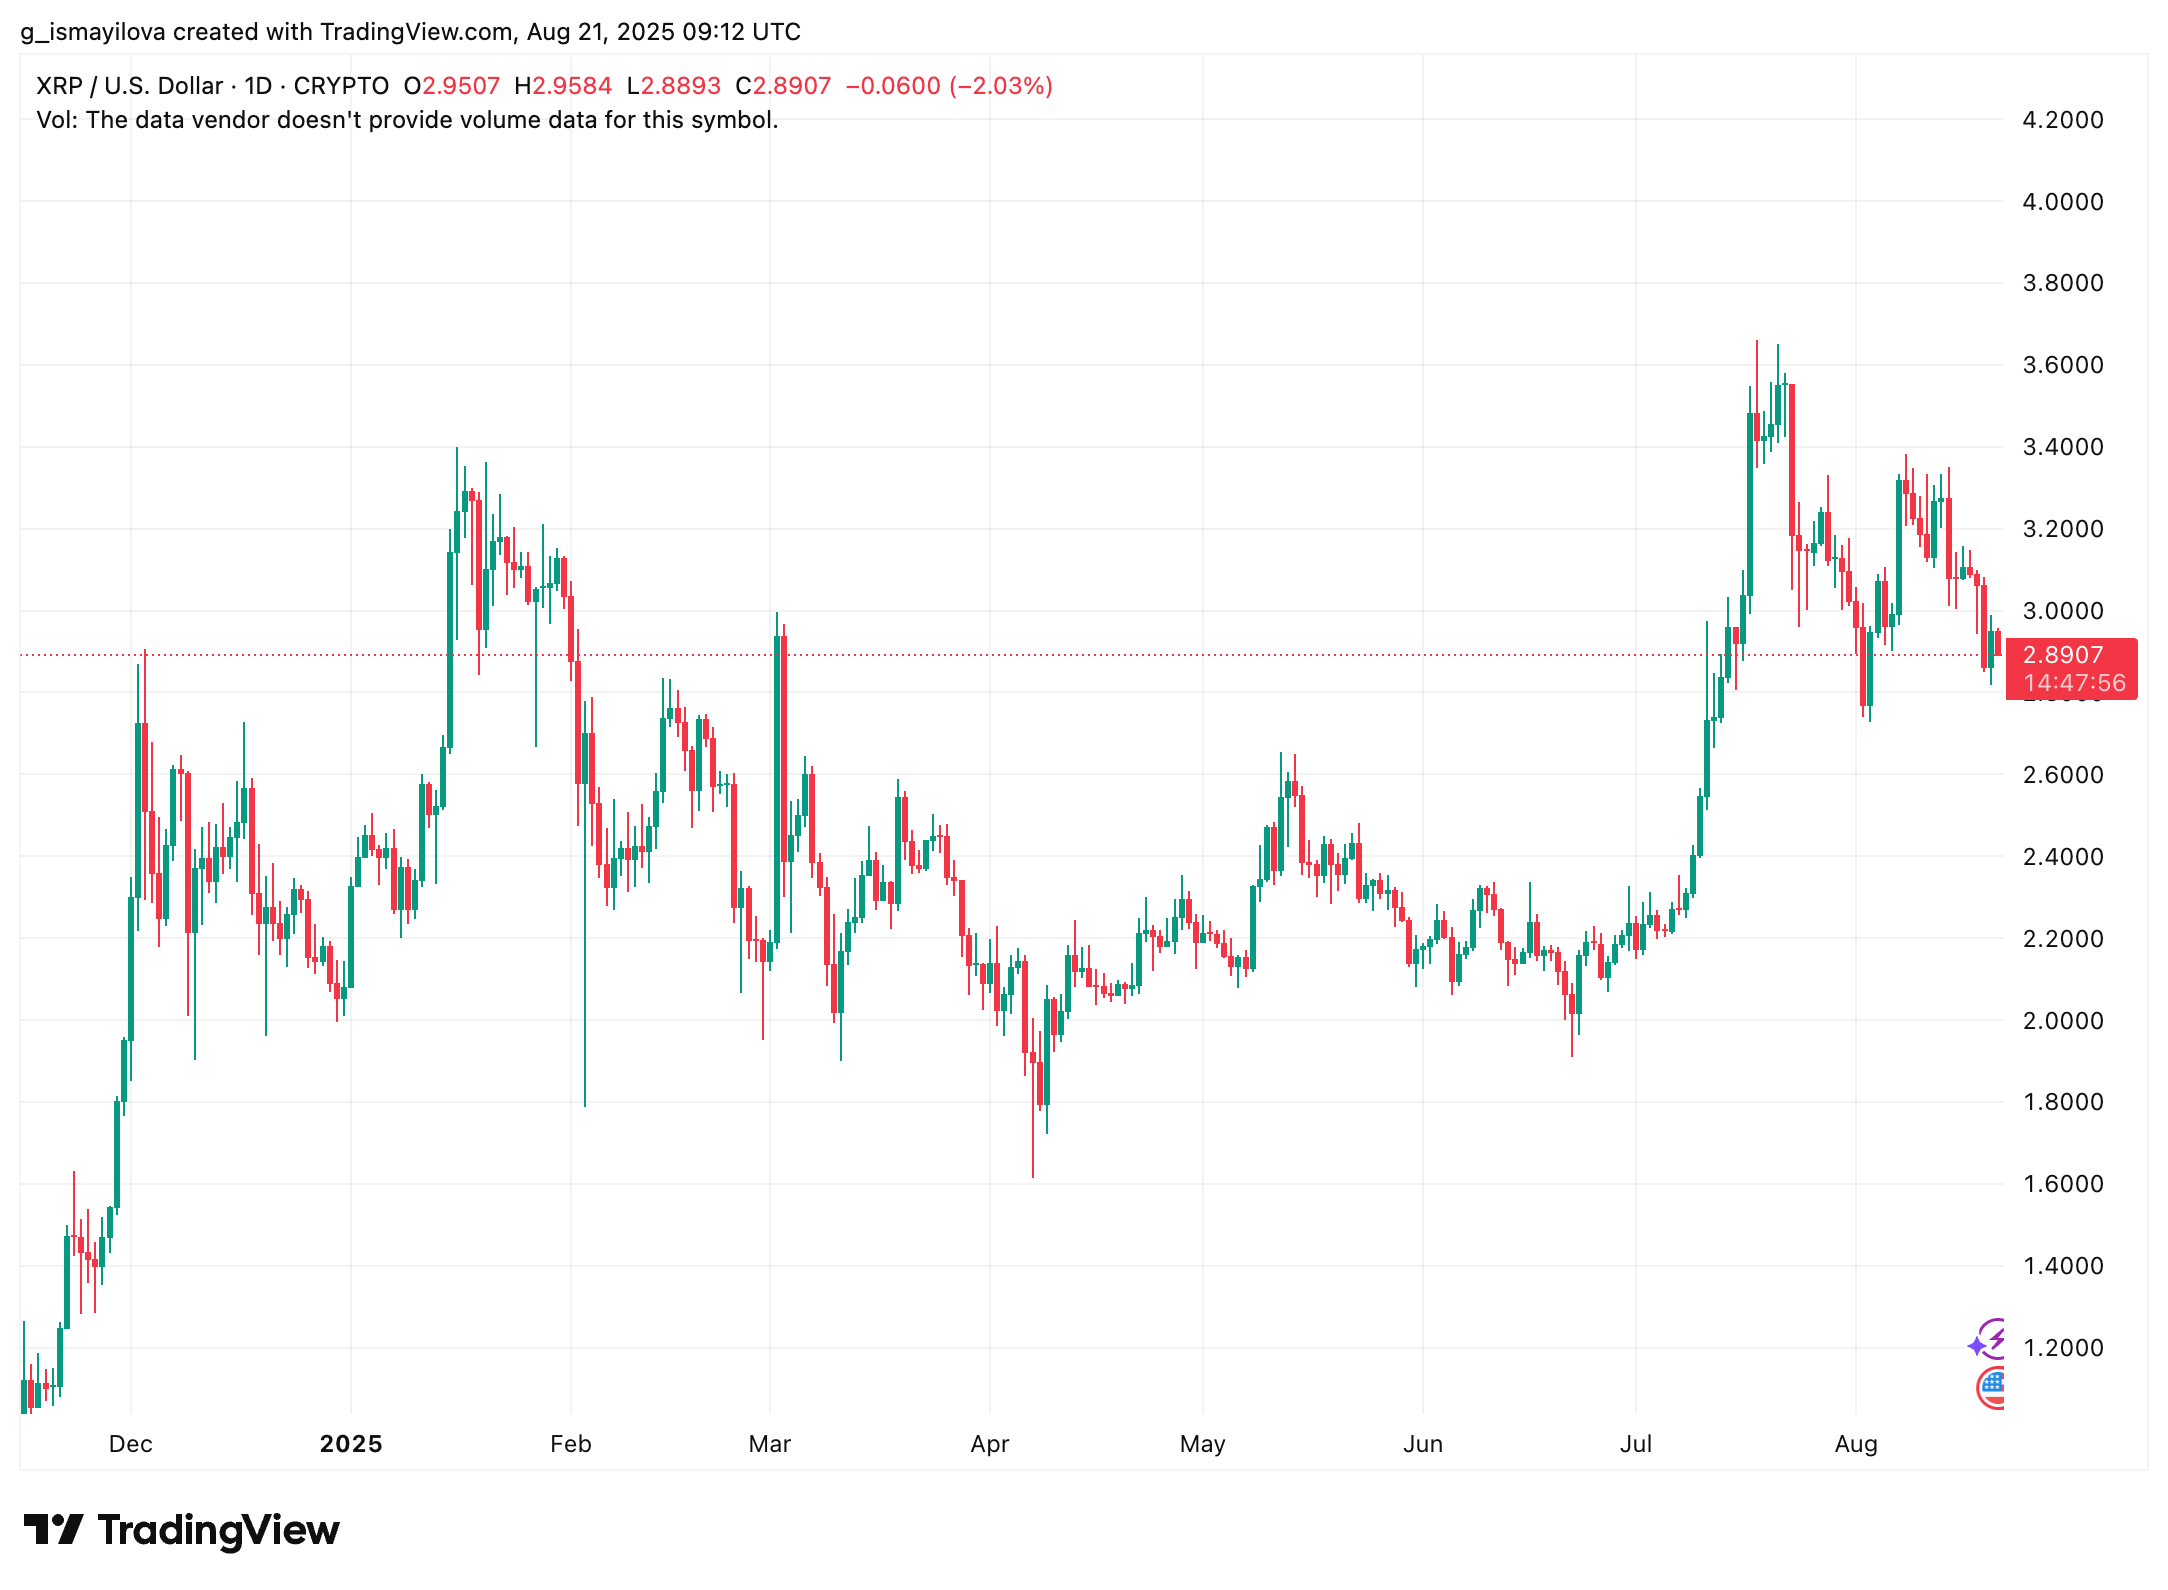
On the charts, things aren’t looking much better. XRP has dipped below its 20-day and 50-day moving averages, signaling bearish momentum. The Relative Strength Index (RSI) is also forming a bearish divergence, indicating that the token’s previous uptrend might be running out of steam.
Further confirmation of the bearish trend comes from the Aroon indicator, with the Aroon Down sitting at a high 92.86%, while Aroon Up is a mere 7.14%. This suggests that the bears are firmly in control.

What’s Next for XRP?
If this bearish trend continues, XRP could be heading toward a potential correction to $2.70, a level that previously served as key support. If it breaks below that, we might see the price drop further, heading toward the $2.30 mark, which aligns with the 23.6% Fibonacci retracement level.
Disclaimer: All materials on this site are for informational purposes only. None of the material should be interpreted as investment advice. Please note that despite the nature of much of the material created and hosted on this website, HODL FM is not a financial reference resource, and the opinions of authors and other contributors are their own and should not be taken as financial advice. If you require advice. HODL FM strongly recommends contacting a qualified industry professional.