

XRP, the payments-focused cryptocurrency developed by Ripple Labs, has closed the week below a critical long-term support at $2. The breakdown of this level has raised concerns about sustained selling pressure and the possibility of deeper losses.
Since January, XRP oscillated around the $2 threshold. Each dip below that line previously resulted in quick recoveries, forming a clear pattern of resilience. Over the weekend, that resilience faded. XRP fell below $2 on Sunday and has remained there since. This marks the first confirmed breach of that foundational support in months, a move that often signals a deeper structural decline in technical market analysis.
Veteran trader Peter Brandt has identified a “potential double top” pattern on the XRP chart, suggesting that the token’s price structure could mirror bearish reversals from previous market cycles. “Sure, it may fail, and I will deal with this if it does,” Brandt said on X. “But for now this has bearish implications.”
I know in advance that all you Riplosts $XRP will forever remind me of this post -- ask me if I care
— Peter Brandt (@PeterLBrandt) December 17, 2025
This is a potential double top. Sure, it may fail, and I will deal with this if it does
But for now this has bearish implications
Love it or not -- you need to deal with it pic.twitter.com/yPGjzuqNN3
Indicators confirm downside outlook
The weakening of XRP’s chart goes beyond the psychological $2 mark. Moving averages highlight clear downtrend momentum. The simple moving averages for 50, 100, and 200 days are all going down, which shows that selling pressure is still strong over many time frames.
The MACD histogram, a key momentum gauge, prints deeper bars below the zero line, a sign of stronger downside momentum and fading bullish interest, according to chart readings from TradingView data.
Omkar Godbole wrote that a failure to hold above the support level “unleashes disgruntled holders who flood the market with supply.” He compared it to “a dam release,” where accumulated pressure transforms into a powerful selloff wave.
Technical breakouts below major psychological lines, such as $2 for XRP, often accelerate capitulation events as traders close leveraged long positions or stop-loss orders trigger automatically.
Target zones and Fibonacci support
Based on Fibonacci retracement levels, the next potential support lies near $1.63, the 61.8% level of XRP’s advance from its 2024 low of $0.43 to its 2025 peak of $3.66. The 61.8% ratio, known historically as the Golden Ratio, often acts as a structural pivot in financial markets. If XRP fails to hold the $1.63 area, the next focus shifts to the longer-term moving averages around $1.07, highlighted by technical analysts as the last key defense zone.
Analyst XForceGlobal also linked XRP’s chart pattern to an Elliott Wave corrective structure, arguing that this move forms part of a “five-wave impulse” following the 2024 triangle breakout. A retracement toward $1.20–$1.35 could complete the corrective phase before any renewed expansion attempt.
$XRP
— XForceGlobal (@XForceGlobal) December 13, 2025
The 5-wave impulse after the triangle breakout, the first corrective 3-wave down (to the T), and then the developing Flat structure were all mapped out well in advance. But somehow people assume I’m never bearish.
I will never trade emotions nor the comment section. https://t.co/QxWbJRPhMq
Historical echoes and trader sentiment
Some analysts noted similarities between XRP’s latest movement and its 2018 setup, which preceded a sharp 70% decline. Historical fractals from that cycle illustrate that after losing a comparable final support region, XRP bottomed around one-third of its pre-breakdown value before stabilizing again.
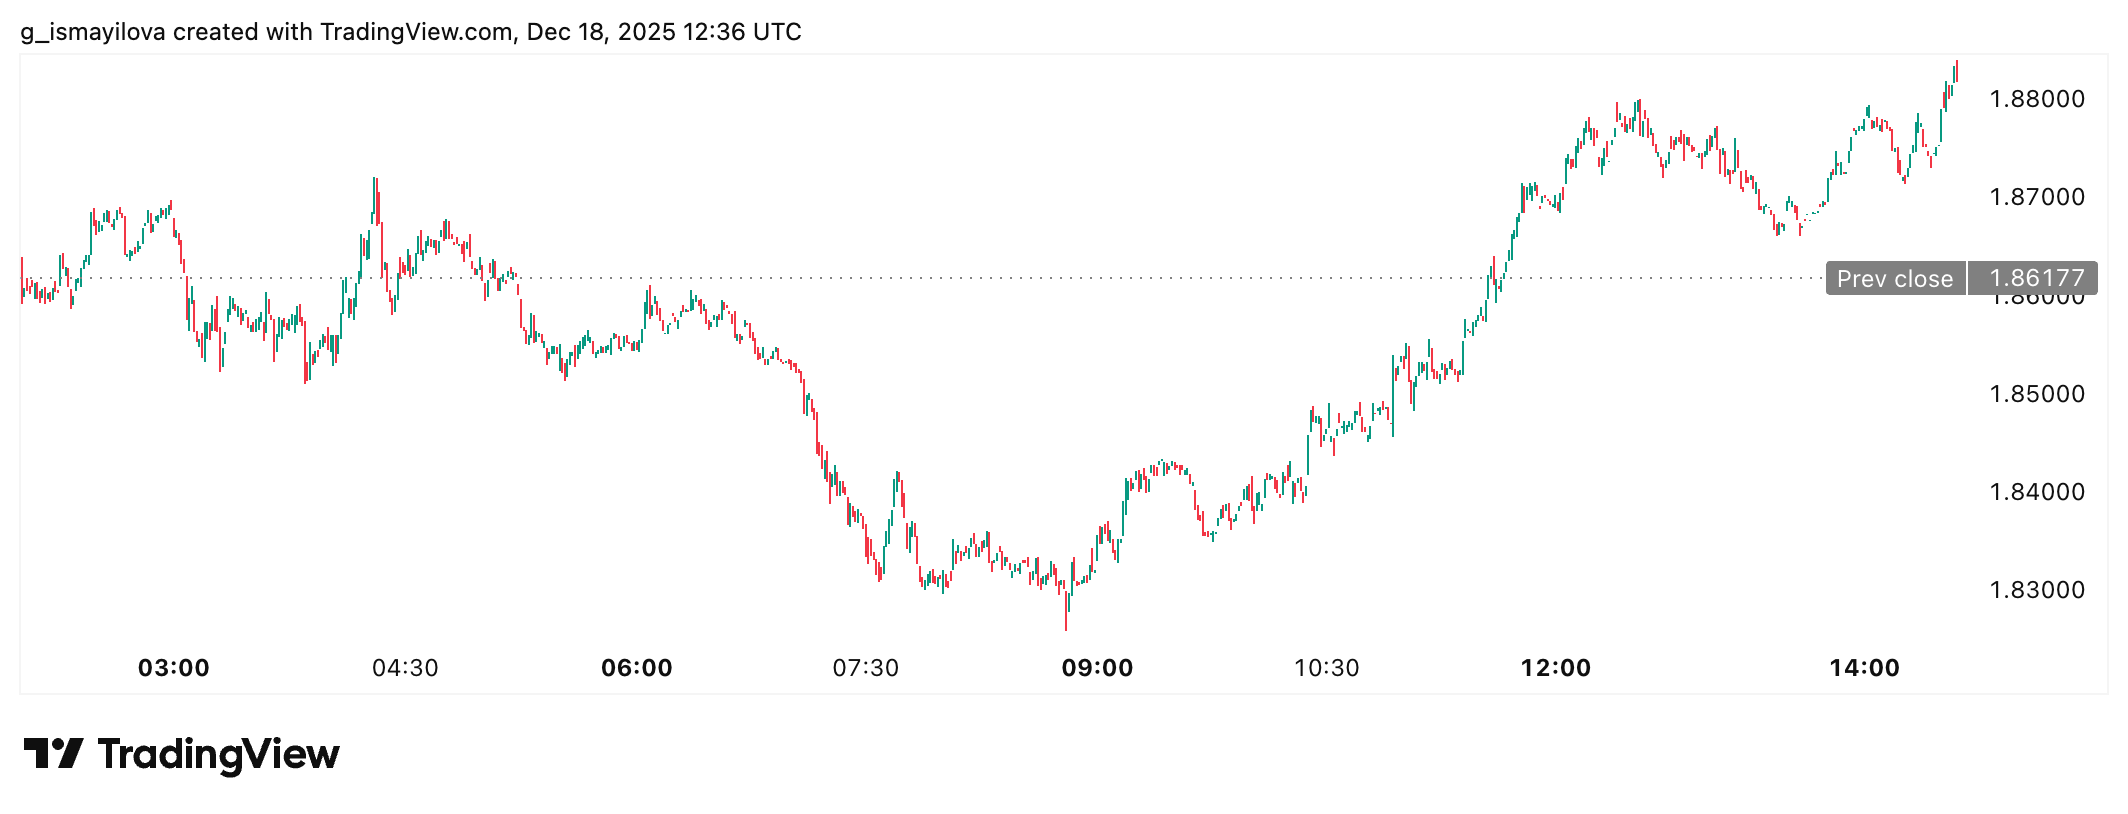
Cointelegraph and BeInCrypto reports confirm that XRP has lost nearly half its value from its 2025 high, retracing almost 50% of its prior bull run. The coin traded near $1.87 at last check.
Despite bearish conviction, analysts say a swift reclaim of the $2 neckline could create a “bear trap,” invalidating the negative outlook and reopening the path toward recovery. However, the burden remains heavy on bulls after repeated failures to close above the earlier resistance at $2.27.
Key supports to monitor
Glassnode data, referenced by analyst Mikybull Crypto, shows that approximately 1.85 billion XRP changed hands between $1.70 and $1.80. This makes that price zone a critical demand area. “XRP needs to hold this support line,” the analyst said. “Otherwise, it’ll be carnage.”
$XRP needs to hold this support line
— Mikybull 🐂Crypto (@MikybullCrypto) December 18, 2025
Otherwise, it'll be carnage pic.twitter.com/zFqWku8TjB
Traders are now watching two key zones, the $1.78 support cluster and the $1.63 Fibonacci pivot, as short-term indicators of potential exhaustion. Should those levels fail, the $1.07 level offers a final technical safety net before revisiting the sub-dollar zone.
While bearish structures dominate charts for now, broader risk sentiment, including upcoming U.S. inflation data, could temporarily influence price direction. A softer inflation reading may fuel a modest recovery across crypto markets, though XRP must show clear strength above $2 to regain a bullish stance.
Disclaimer: All materials on this site are for informational purposes only. None of the material should be interpreted as investment advice. The author has no financial interests in Ripple Labs or related entities at the time of publication. Please note that despite the nature of much of the material created and hosted on this website, HODL FM is not a financial reference resource, and the opinions of authors and other contributors are their own and should not be taken as financial advice. If you require advice. HODL FM strongly recommends contacting a qualified industry professional.