Crypto pricing into early 2026 reflects a market still adjusting to structural changes that were not present in previous cycles.
The sharp correction that followed October’s highs has reduced leverage and thinned speculative positioning, but it has not reversed the underlying trend of institutional participation.
Earlier cycle models, particularly the idea that the year after a halving must deliver a broad downturn, are being questioned more openly. Spot ETF flows, clearer regulatory signaling in the U.S., and deeper integration with traditional trading infrastructure have altered how capital enters the market and how risk is distributed.
Bitcoin remains the market’s reference point
Bitcoin’s retreat from its October peak near $126,000 to levels closer to $90,000 reset expectations after a period of unusually one-sided positioning. The rally was closely tied to steady inflows into U.S. spot ETFs, which absorbed supply at a pace that outstripped previous institutional entry phases.
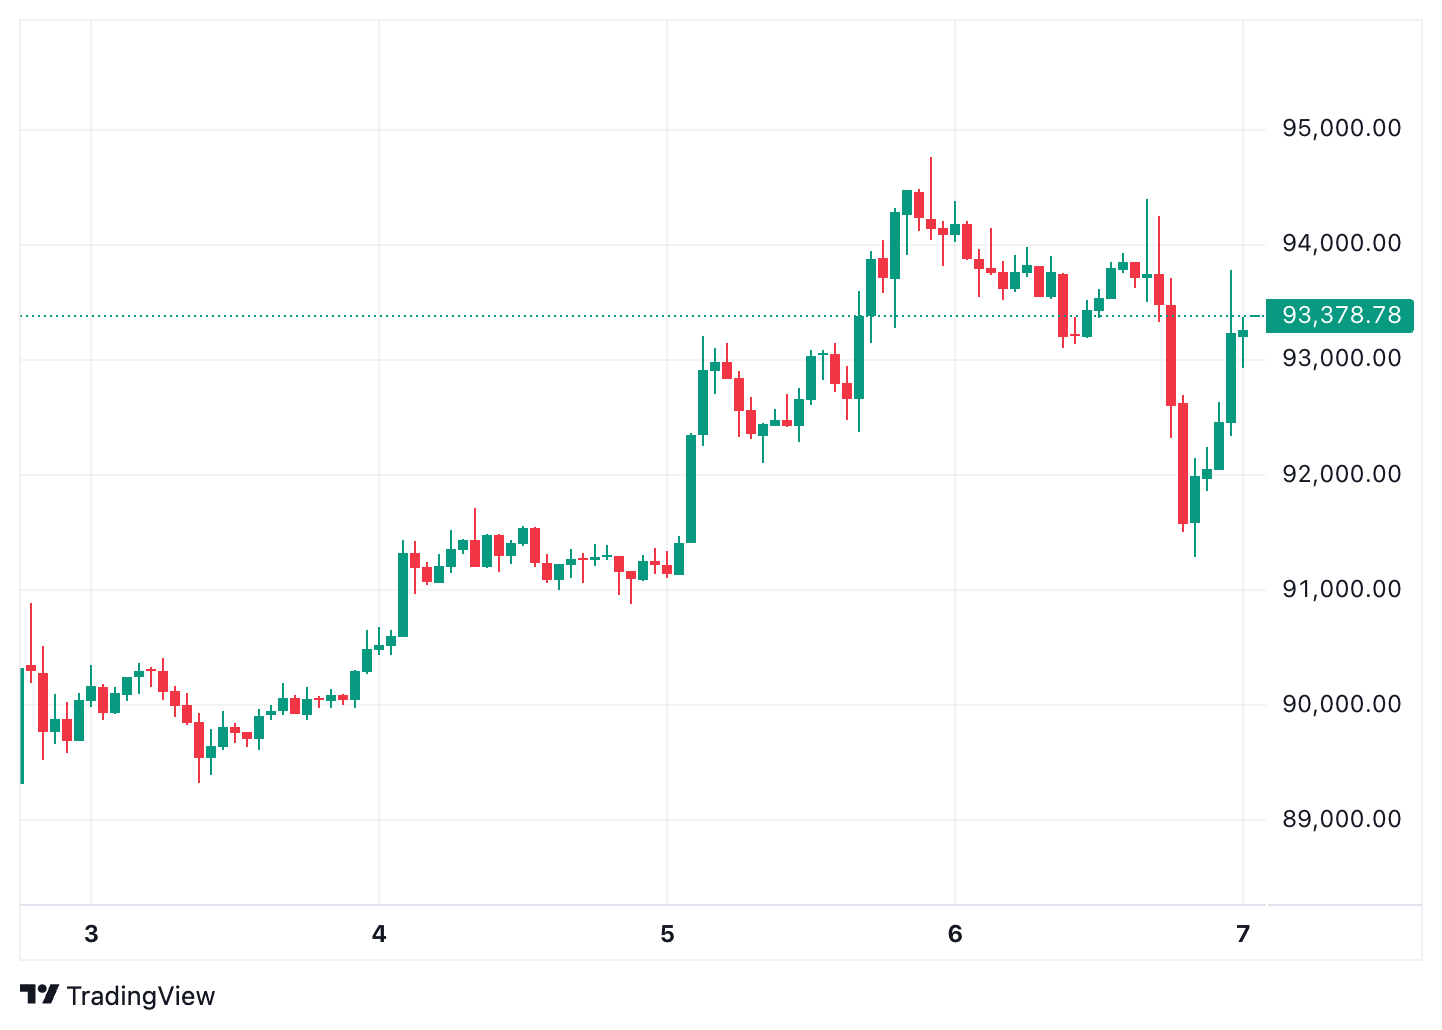
The subsequent pullback has unfolded without signs of stress at the network level.
Hash rate has continued to trend higher, while transaction throughput has remained stable. That divergence suggests the correction reflects market structure rather than a deterioration in fundamentals.
As long as ETF flows remain broadly constructive, Bitcoin continues to function as the benchmark against which risk is priced across the sector.
Ethereum trades through a valuation reset
Ethereum has struggled to keep pace with Bitcoin since late summer, sliding from near $5,000 to the low-$3,000 range.
The price weakness has coincided with a broader compression in risk appetite rather than a slowdown in usage.
On-chain activity has remained resilient, supported by Layer-2 settlement and relatively stable fee dynamics. Validator participation has also steadied after earlier periods of outflows, keeping a large share of supply locked despite softer spot prices. The gap between network activity and market valuation has widened, leaving ETH more sensitive to shifts in sentiment than to short-term changes in usage metrics.
The recovery has been supported by modest but consistent buying interest, with ETH posting several 3%–5% daily gains in the first trading sessions of the year.
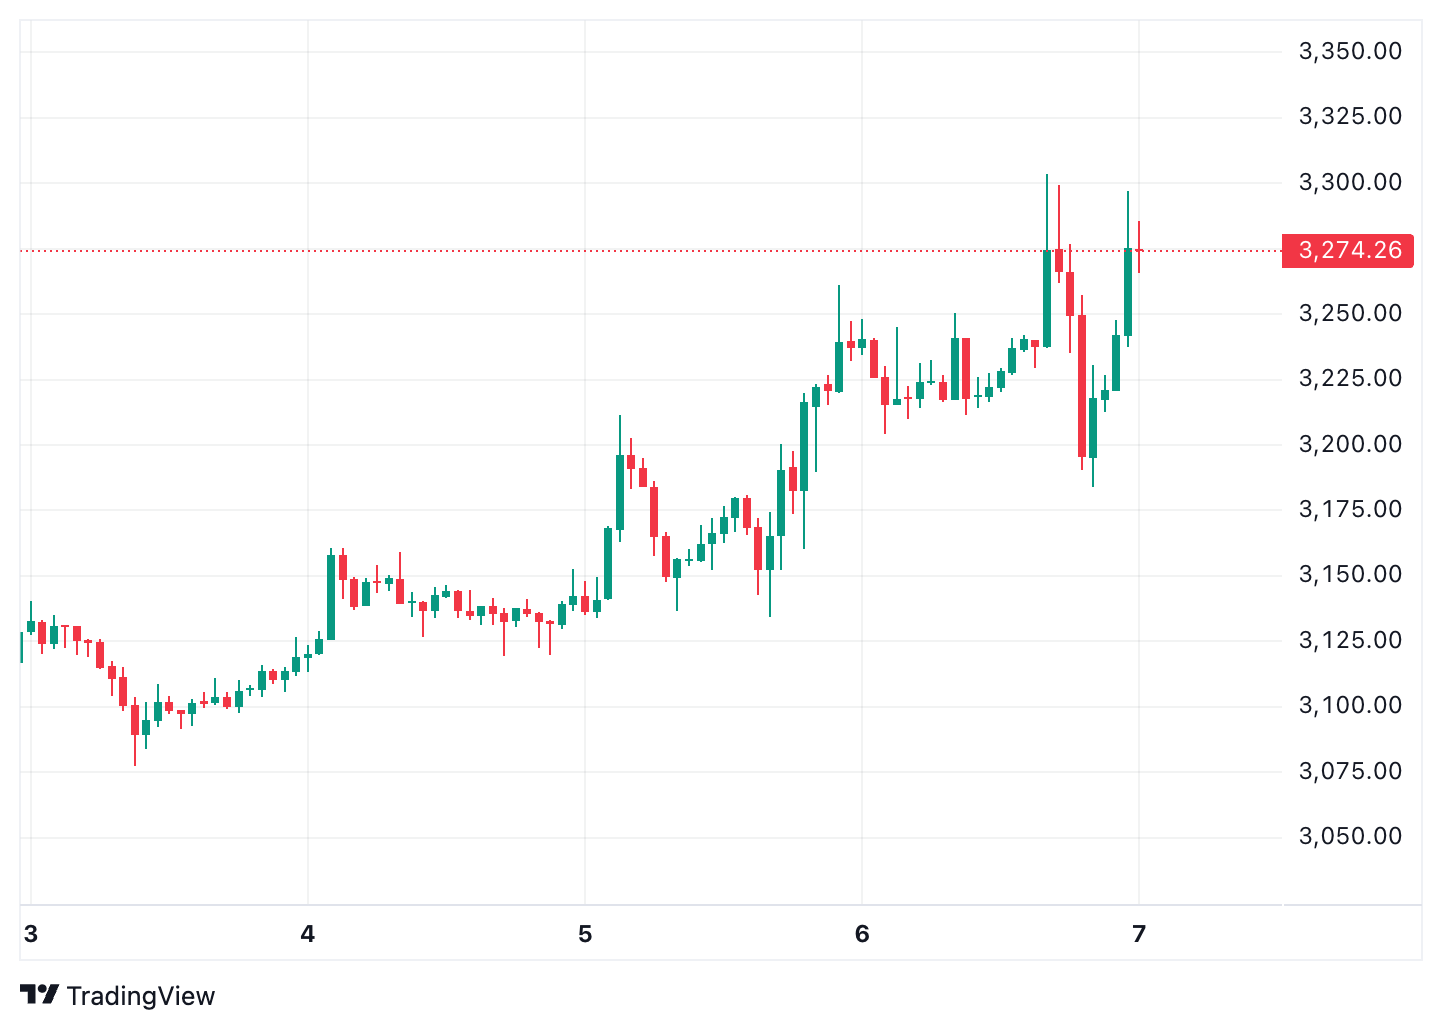
For now, the $3,000 level has emerged as a psychological line in the sand as the market gauges whether the broader recovery can sustain itself.
Solana holds liquidity through volatility
Solana continues to stand out for its ability to retain trading volume during periods of market stress. Even as prices consolidated in the second half of 2025, turnover on Solana-based venues remained elevated, supported by frequent token launches and active short-term trading. Solana entered 2026 with activity metrics and price behavior that suggest traders are watching its response to the broader market correction.
According to early January data, SOL was trading in the low $100s after retreating from its 2025 highs near the $290 area.
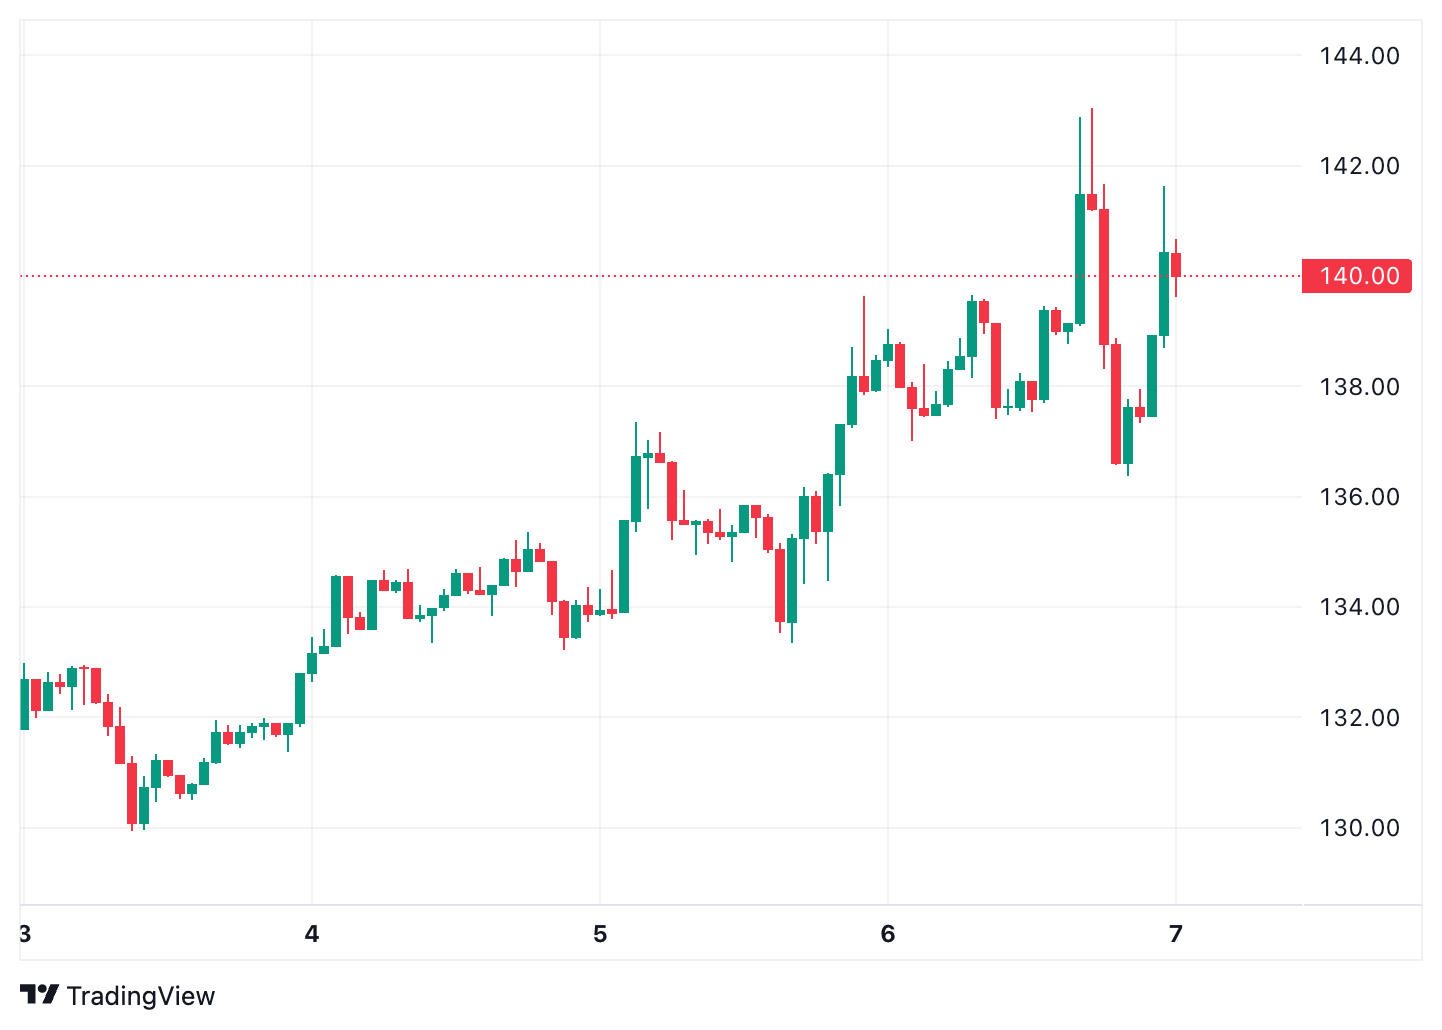
On shorter timeframes, Solana’s price action showed tentative strength as it approached resistance levels near $140–$155, a zone that had previously served as interim support and supply. Trading volume remained notable relative to other midsize layer‑1 assets, with SOL repeatedly posting multi‑week peaks in turnover during early January sessions.
This behavior reflects a pattern seen in late 2025: Solana’s network and market activity often outpaced price performance.
On‑chain data throughout the correction period continued to show sustained decentralized exchange volume and developer engagement, even as broader crypto sentiment weakened.
For now, the $120–$125 range appears to be an interim support bracket, with any decisive break above it likely to draw renewed attention from traders looking for a breakout continuation.
XRP reprices after regulatory clarity
XRP entered 2026 with price behavior reflecting evolving market conditions and reduced regulatory uncertainty.
According to early January updates, XRP was trading in the low $2.00 range, recovering ground after a period of sideways movement in late 2025.
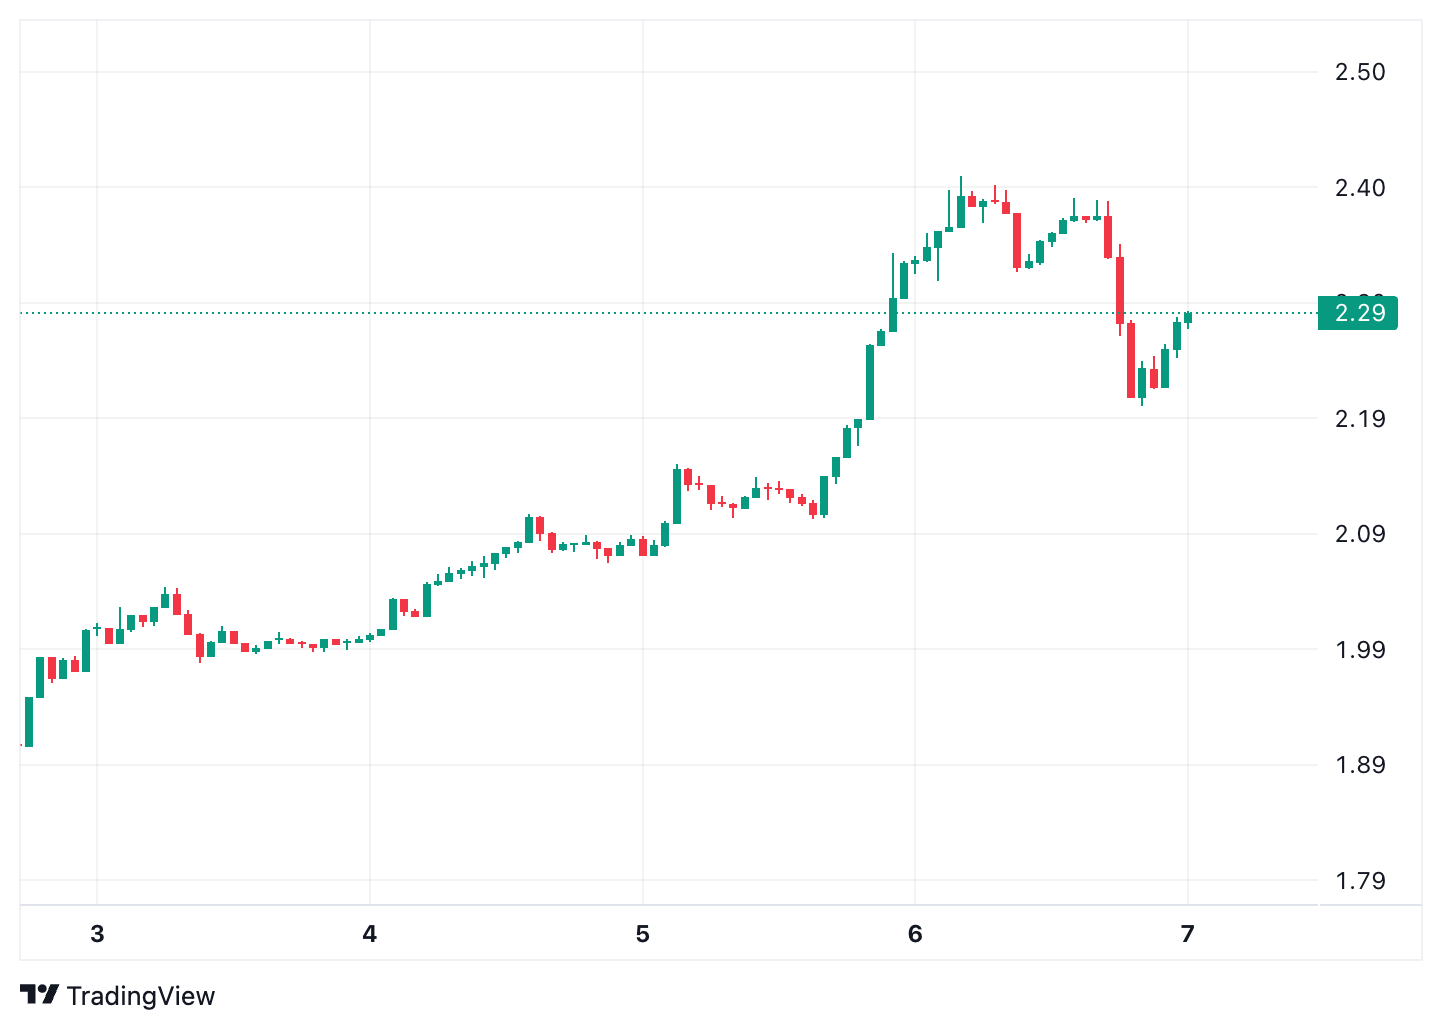
On recent intraday charts, XRP has tested short‑term resistance near the $2.30–$2.40 area, with moderate upticks in trading volume suggesting renewed participation from both retail and institutionally linked desks. This trend aligns with clearer market access following regulatory developments that eased long‑standing legal constraints in the United States, allowing broader exchange listing and participation.
Network activity around XRP has remained stable through the correction, with liquidity measures on major trading venues holding steady relative to peer assets.
For now, the zone around $2.00 has emerged as an important reference point; sustained support above this level could set the stage for tactical moves toward first resistance, while weakness below it might extend consolidation pressures.
Dogecoin shows retail engagement, not fundamentals
Dogecoin continues to show distinct trading patterns compared with other major digital assets. According to early January pricing data, DOGE was trading in the mid‑$0.10 range after retracing from its headline‑driven peaks in 2025. Despite broader market pressure, DOGE repeatedly surfaced among the top‑tier assets by daily trading volume, a reflection of persistent retail interest rather than protocol development or institutional flows.
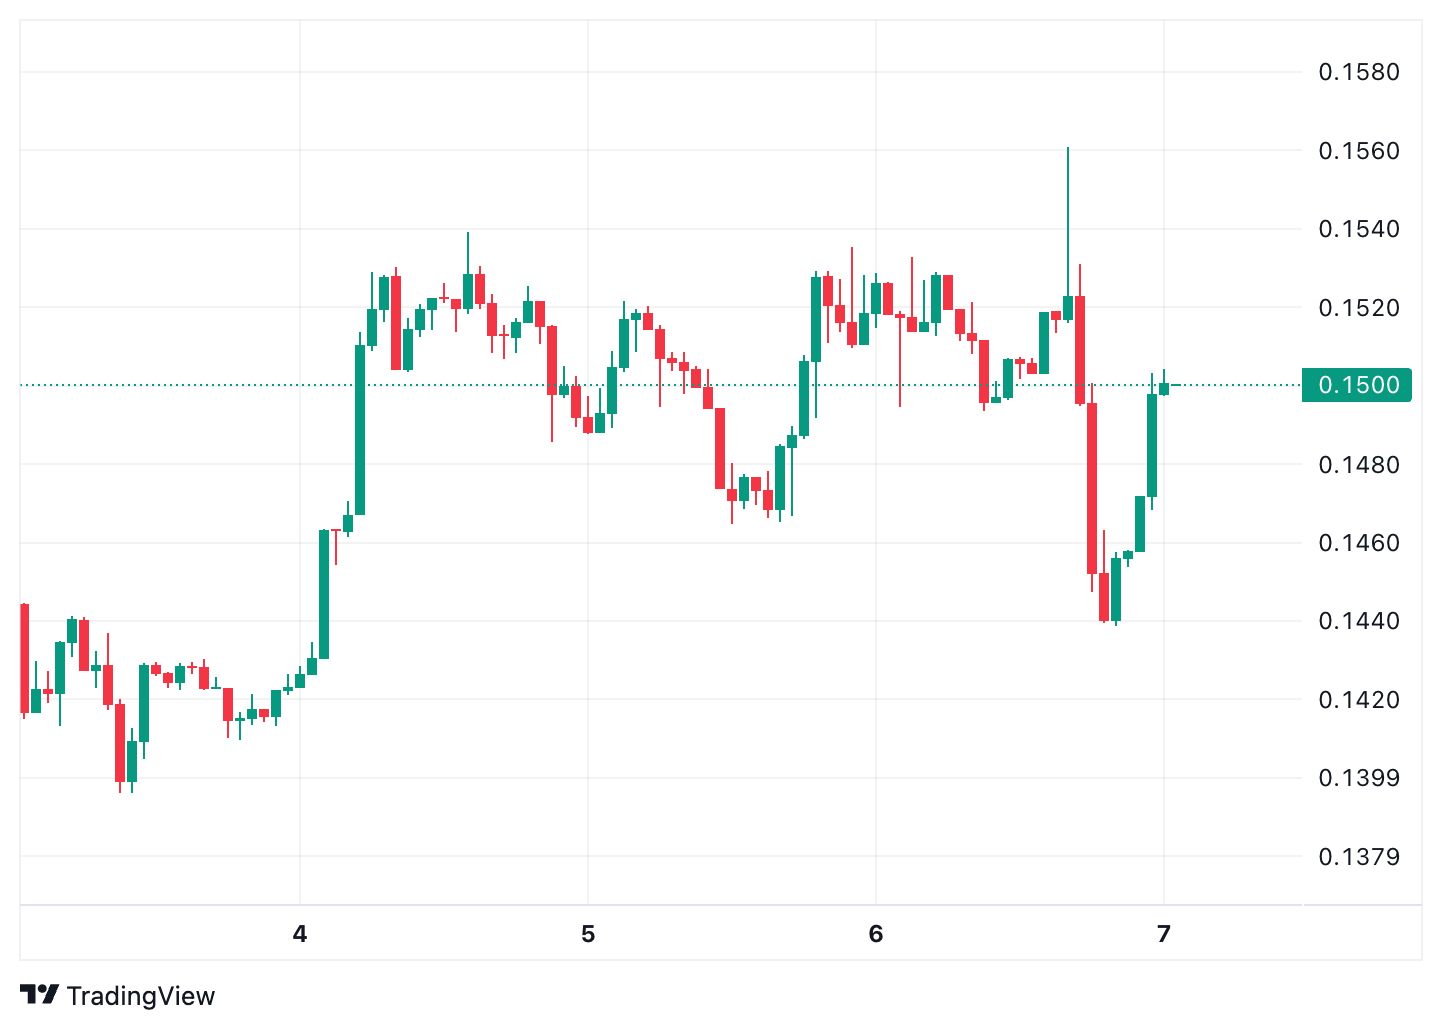
Short‑term price action showed support around the $0.13–$0.15 bracket, with periodic breakouts toward resistance near $0.19–$0.20 coinciding with brief upticks in speculative positioning.
Its liquidity profile remains robust relative to many mid‑cap alternatives, and DOGE’s frequent volume spikes continue to mirror shifts in short‑term sentiment among active traders.
Dogecoin’s function in early 2026 is less about foundational adoption and more about serving as a market temperature gauge, particularly for retail participants testing positions as broader risk appetite fluctuates.
Conclusion
January 2026 shows a diverse crypto market: Bitcoin and Ethereum hold steady as institutional anchors, Solana and XRP gain from innovation and regulation, and Dogecoin keeps retail interest alive. These five coins offer a clear view of current momentum and potential opportunities as the year begins.

Disclaimer: All materials on this site are for informational purposes only. None of the material should be interpreted as investment advice. Please note that despite the nature of much of the material created and hosted on this website, HODL FM is not a financial reference resource, and the opinions of authors and other contributors are their own and should not be taken as financial advice. If you require advice. HODL FM strongly recommends contacting a qualified industry professional.