

Pi Network's Directional Movement Index (DMI) is showing exhaustion. The Average Directional Index (ADX) has dropped to 34 from 44.59 yesterday, after a sharp ascent from 16.89 only three days ago. This suggests a trend that had skyrocketed but is now losing steam.
For newcomers, the ADX measures the strength of a trend, not the direction. Anything under 20 is a weak or non-trending environment, and anything above 25 is a clear signal of a strong trend. With the ADX still above 30, Pi is technically still in trend mode, but momentum is clearly slowing.
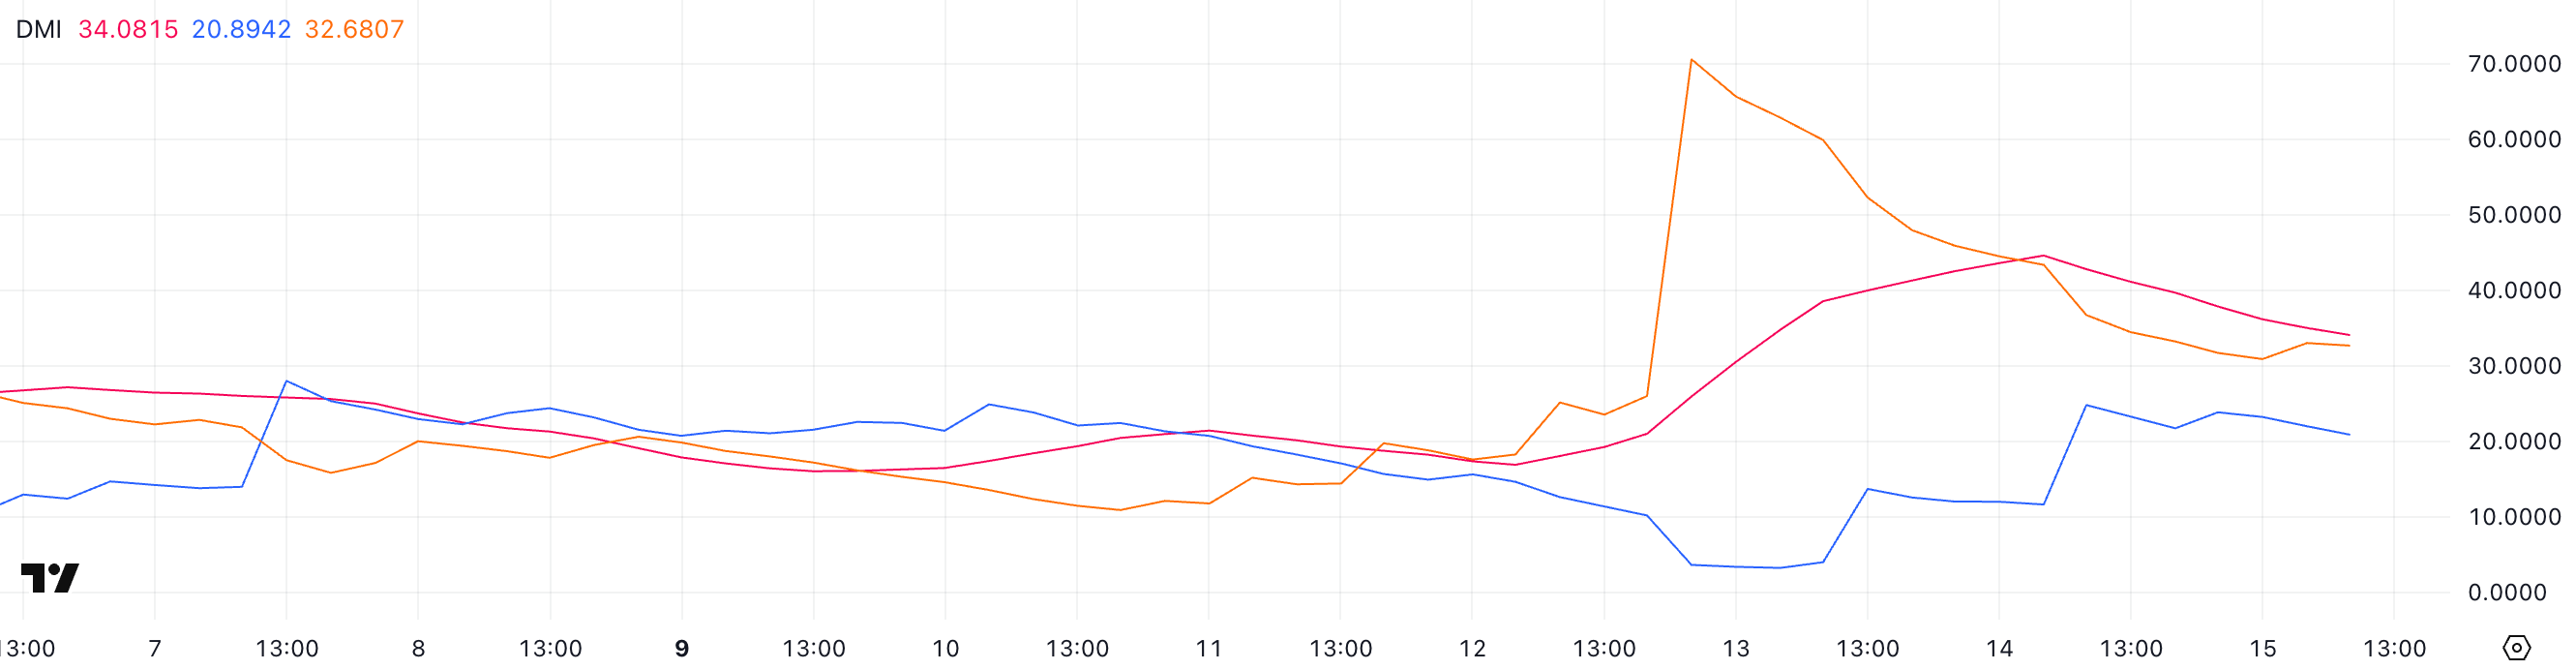
Looking at the directional indicators, +DI has rallied to 20.89 from a low of 4 two days ago, showing rising bullish pressure. On the other hand, -DI has dropped sharply to 32.68 from a high of 70.57 three days ago, reflecting that bearish momentum is weakening.
This directional strength change could be a sign of a change in sentiment. As long as +DI keeps going up and -DI keeps going down, we can expect the price of Pi to bounce back or turn neutral after a deep sell-off.
PI CMF Shows Mild Buying Pressure After Recent Spike
Pi Network Chaikin Money Flow (CMF) stands at 0.07, a decline from 0.19 two days ago but an increase from -0.05 three days ago. The CMF tracks money flowing into or out of an asset over the price and volume. Positive CMF above 0 demonstrates buying pressure, while a negative one reflects selling pressure.
As the CMF is now 0.07, there's light but still positive buying pressure in place. Not enough to suggest full accumulation, but it shows that money is still coming into Pi, just at a slower pace than two days ago.
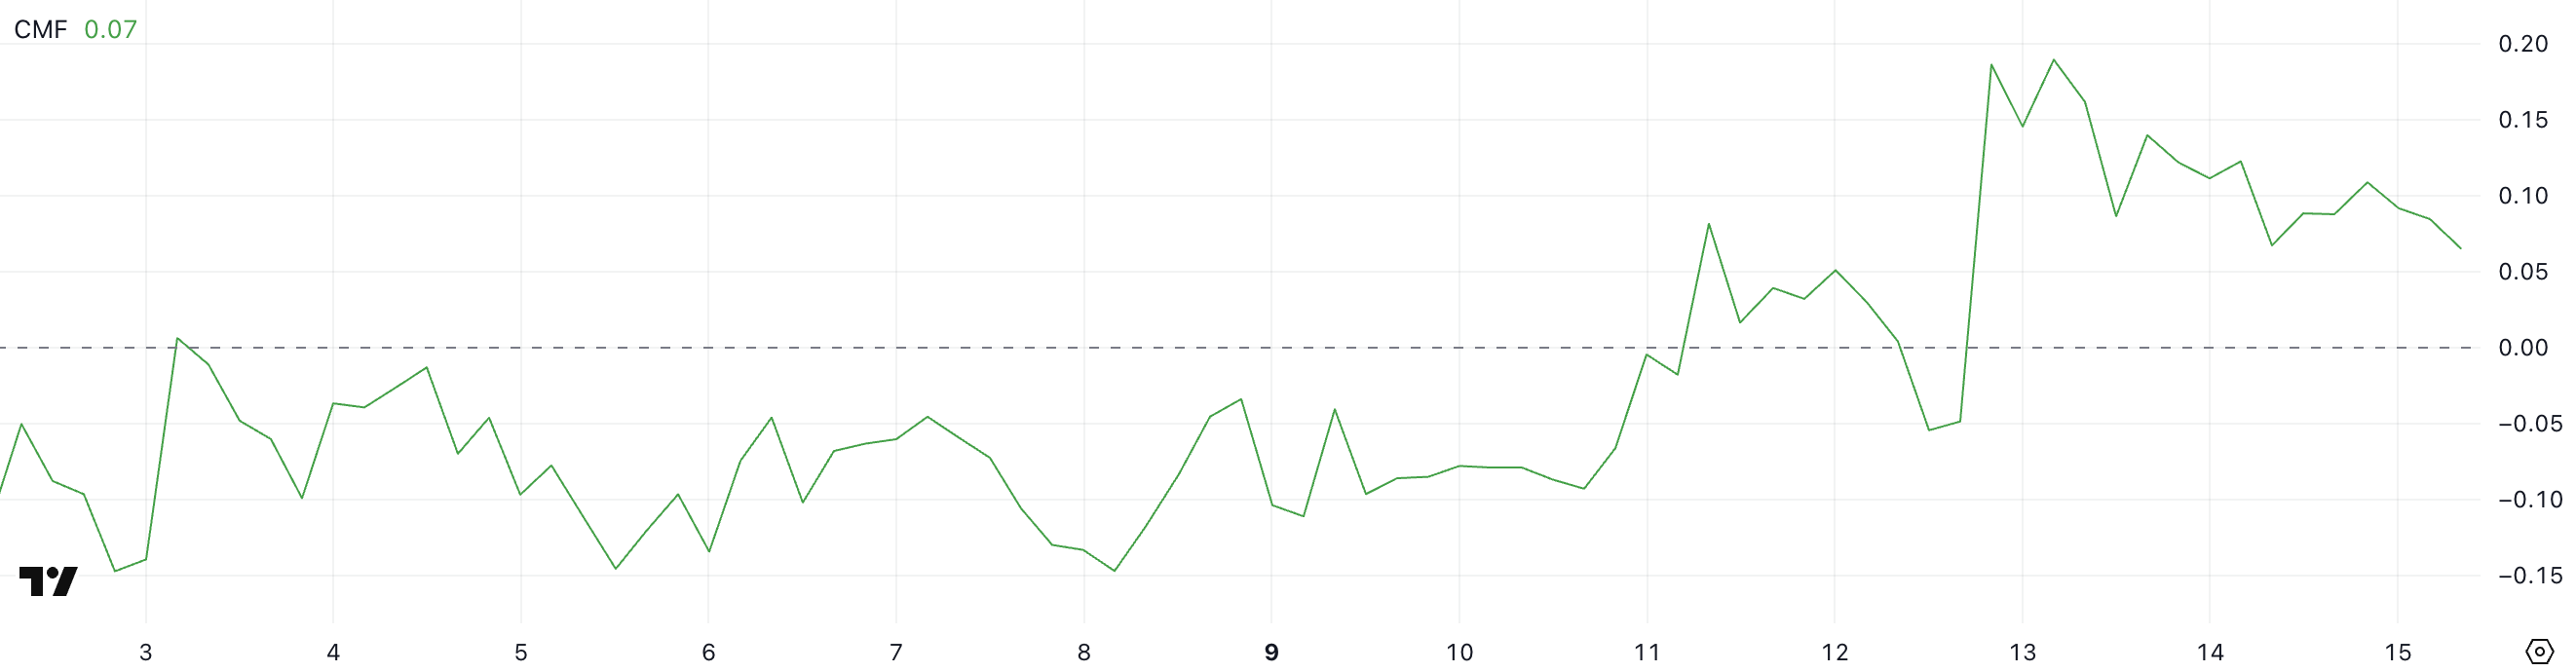
If the CMF stays positive, it will support price stabilization or gradual recovery. However, if it dips into negative territory again, we can see weak demand and potential drop in the price of Pi.
Breakout or Breakdown? PI Trades Near Crucial Levels
Pi Network EMA lines show consolidation time after bounce from the sharp drop because of the Israel-Iran conflict escalation. Price action is currently trading just above a very critical support at $0.601. If this support is broken, Pi can drop to $0.542, and if bearish momentum strengthens, it can drop further to $0.40.
At present, the market structure is filled with ambiguity since there is no clear bullish or bearish trend controlling the market.
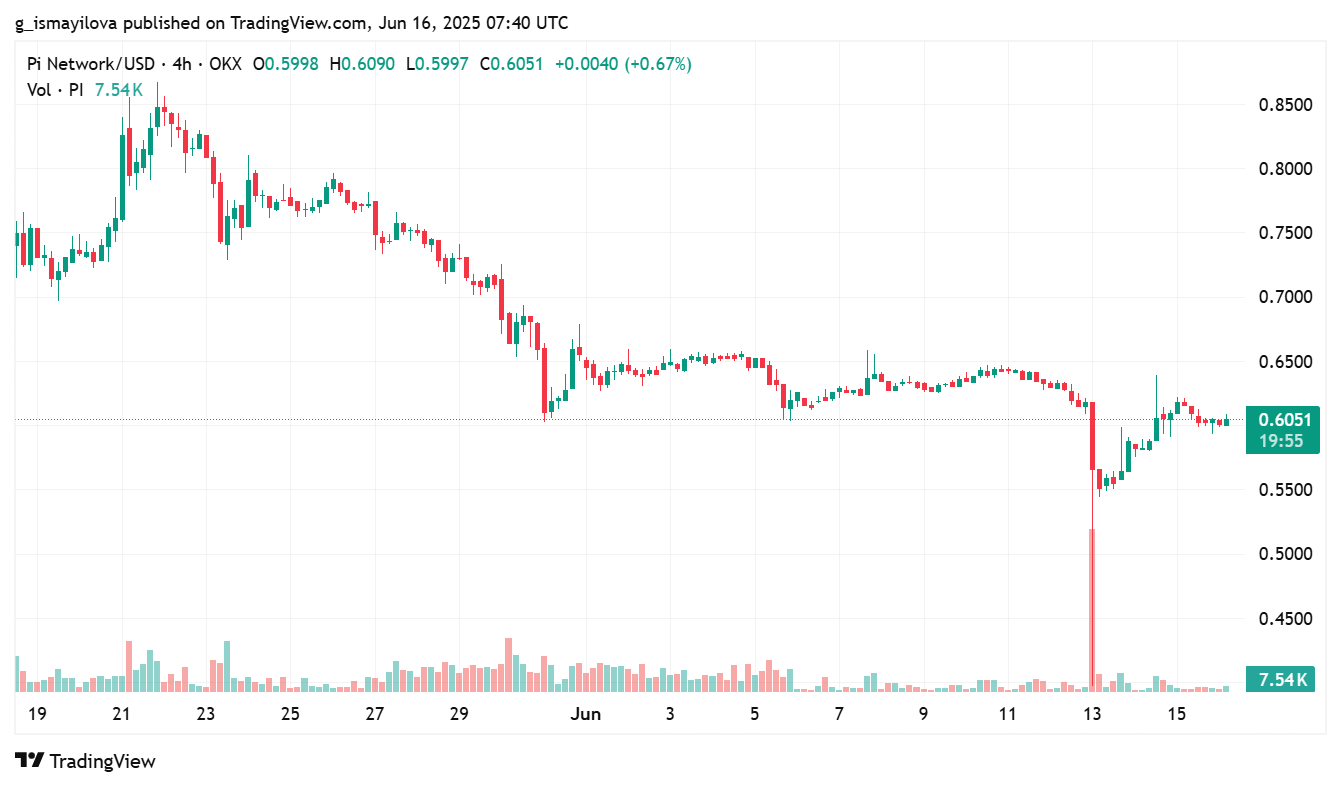
In the positive scenario, a breakout of the resistance levels at $0.647 and $0.658 by Pi can trigger a new uptrend. A breakout above these levels may enable Pi to travel towards $0.796.
Since the current EMA setup shows a neutral stance, the market is awaiting a decisive move in either direction.
 Alex Shepel
Disclaimer: All materials on this site are for informational purposes only. None of the material should be interpreted as investment advice. Please note that despite the nature of much of the material created and hosted on this website, HODL FM is not a financial reference resource, and the opinions of authors and other contributors are their own and should not be taken as financial advice. If you require advice. HODL FM strongly recommends contacting a qualified industry professional.