
The Collapse Begins — OM Crashes 90%, $5.5 Billion Wiped in an Hour
In a dramatic turn of events on April 13, the MANTRA (OM) token plummeted over 90% within an hour, sending shockwaves through the Real World Assets (RWA) sector and erasing more than $5.5 billion in market capitalization. The token plunged from a high of $6.33 to under $0.50, drawing instant comparisons to the infamous Terra LUNA collapse of 2022.
The crash appeared to be triggered by a $41 million OM deposit into the OKX exchange from a wallet allegedly tied to @LaserDigital_, which received its OM holdings from GSR a year prior.
$OM is the $LUNA of this cycle.
— Sjuul | AltCryptoGems (@AltCryptoGems) April 13, 2025
$6B+ wiped out within 30 minutes.
But why did it happen?
🧵: THE $OM CRASH DECODED👇
( MUST REPOST AND LIKE ) pic.twitter.com/7Cz8ymsrHH
With the MANTRA team reportedly controlling 90% of the total OM supply, the deposit ignited panic over insider selling and price manipulation.
A wallet labelled as @LaserDigital_ deposited over $41M worth of $OM into OKX just 2 days ago.$OM price has dumped 90% in the last few hours❗️
— Amir Ormu (@AmirOrmu) April 13, 2025
This wallet received the majority of its $OM holdings from GSR over a year ago!
Address:
0xB37DBDec19737d52cDC8fD969B92bAA9e044f26A pic.twitter.com/PRoRFGNLRH
Community suspicion intensified as past concerns resurfaced—allegations of tokenomics manipulation, undisclosed OTC deals at steep discounts, and delays in promised airdrops. Panic spread quickly, triggering forced liquidations, stop-loss orders, and a massive sell-off across centralized exchanges.

As the crisis unfolded, MANTRA’s official Telegram was locked, and the team denied initiating any sell-off. Co-founder John Patrick Mullin blamed centralized exchanges, citing reckless forced closures that blindsided OM account holders.
“The timing and depth of the crash suggest that a very sudden closure of account positions was initiated without sufficient warning,” said Mullin.
Meanwhile, Binance issued a statement clarifying that it had warned users about OM tokenomics changes and that the crash stemmed from cross-exchange liquidations, not internal issues. Binance also reaffirmed that leverage risk controls had been in place since October 2024.
The fallout was immediate across the sector. The broader RWA market dropped by 13.3%, plunging to a market cap of $41.0 billion. Though some analysts suggested the damage could be contained, comparisons to Terra’s downfall loomed large.
For an update on the latest on $OM’s market movements, please refer to our latest community update from @jp_mullin888. We’ll be providing further updates in the coming hours and days, to discuss these events further. We greatly appreciate the support that we have received over…
— MANTRA | Tokenizing RWAs (@MANTRA_Chain) April 14, 2025
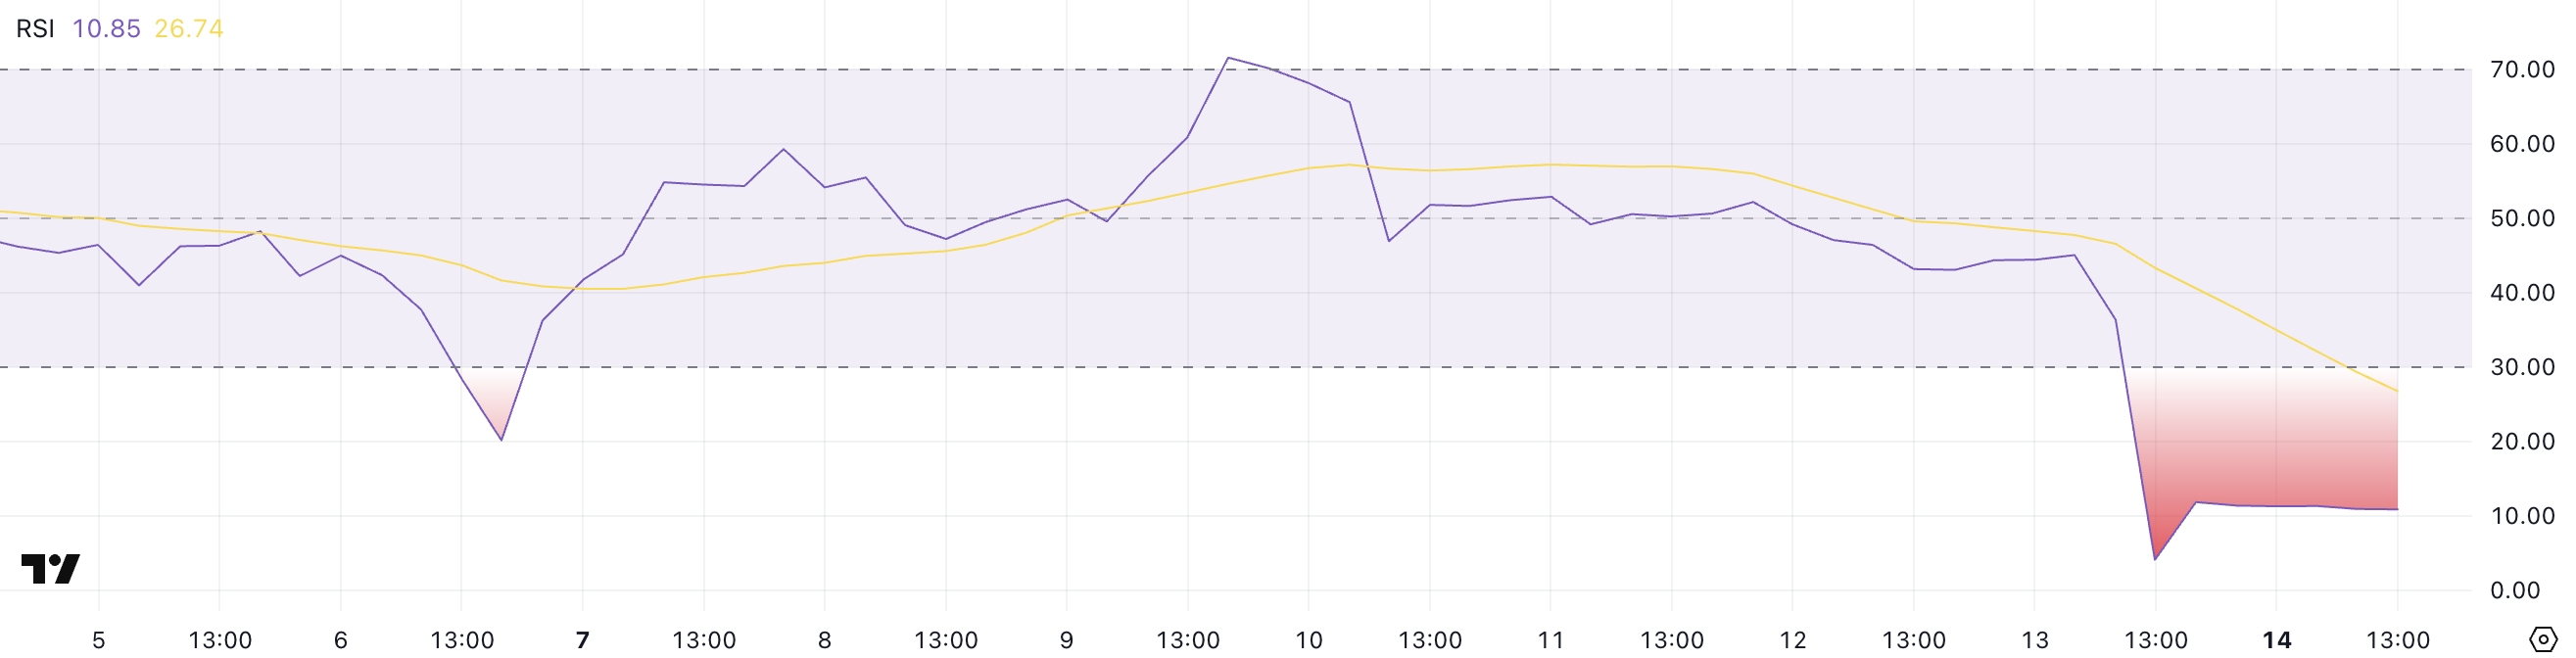
Technical Indicators Worsen — OM Mirrors LUNA’s Final Days
By the next day, OM’s technical indicators painted a grim picture. The token’s Relative Strength Index (RSI) had crashed from 45 to a near-unprecedented 4, signaling extreme oversold conditions and an almost total absence of buying support.
RSI values under 30 indicate an oversold asset. OM’s value near 4 suggested complete market exhaustion.
Even Terra LUNA saw some “buy the dip” action during its collapse. But for OM, that rebound seems elusive. The Directional Movement Index (DMI) confirmed the trend: selling pressure remains dominant with a -DI at 69.69 and +DI at just 2.42—a staggering imbalance.
“As long as this dynamic continues—strong trend strength, high selling pressure, and near-zero buying pressure—OM is likely to stay under severe bearish pressure,” analysts warned.

The ADX, a key indicator of trend strength, stood at 47.23, far above the critical 25 level—suggesting that OM’s collapse is not only intense but sustained.
While OM flounders, there’s little confidence in a quick recovery. The token risks sliding further or entering a prolonged phase of stagnation without a major catalyst or transparency from the team.
ONDO Surges as Investors Rotate Capital Away from OM
Amid the carnage, Ondo Finance (ONDO) has emerged as a relative winner, gaining 4% in the last 24 hours and experiencing a 13% jump in trading volume. ONDO has now become the third-largest RWA token, as panicked investors rotate out of OM into more stable alternatives.
Dear @MANTRA_Chain @_RichardTeng @cz_binance
— JB (@Jeetburner) April 13, 2025
I invested $3,500,000 into your RWA token, $OM. That investment is now worth barely $200,000, a drop of over 90%.
My intention was to support the future of RWAs. I conducted thorough due diligence, and the supposed partnership with… pic.twitter.com/G11642FWYC
Technicals support the move. ONDO’s DMI chart shows bullish momentum, with the +DI at 25.17 and -DI down to 14.36, while the ADX, though cooling, still supports a positive trend. Its Chaikin Money Flow (CMF) has also surged from -0.17 to -0.06, indicating capital is returning.

Even more promising, a golden cross just formed on ONDO’s Exponential Moving Averages (EMA)—a bullish signal suggesting upward momentum is gaining strength. If ONDO clears resistance at $0.956, it could test the $1.20 level in the short term.
“The surge could be linked to a shift in sentiment post-OM collapse, as capital may be rotating to other RWA coins like ONDO,” analysts said.

Still, ONDO’s rally remains tentative. If it fails to hold support at $0.82, a breakdown toward $0.73 or even $0.66 remains possible. For now, however, ONDO appears to be benefiting from the vacuum left by OM’s implosion.
Sector Shock, But Not Collapse
While the collapse of MANTRA’s OM token is undoubtedly one of the most dramatic crypto events since Terra LUNA, early signs suggest that the RWA sector as a whole remains resilient.
ONDO’s rise highlights investor confidence in quality RWA projects with transparent fundamentals and strong community support. Long-term projections from Ripple and Boston Consulting Group remain bullish, forecasting the RWA sector to balloon from $0.6 trillion to $18.9 trillion by 2033, reflecting a 53% CAGR.
The coming days will be critical. MANTRA’s credibility, investor trust, and the broader RWA ecosystem hang in the balance. Whether OM becomes the next cautionary tale or stages an unlikely recovery will depend on how the team addresses transparency, governance, and market confidence going forward.
 HODL Team