
Welcome to HODL FM. Today, we’ll draw insights from onchain activity to help us determine where the Bitcoin market is heading to.
Bitcoin traders are starting to toss around the idea of retesting all-time highs, but before the party starts, BTC needs to lock in some solid support.
That could actually happen—if the bulls can break through the current market standoff, considering that onchain metrics are hinting at minimal capital movement in or out.
This week, we're mixing things up and pulling our price forecast from several onchain insights to see what network activity got to say about the future of the largest cryptocurrency.
Bitcoin’s Realized Capital
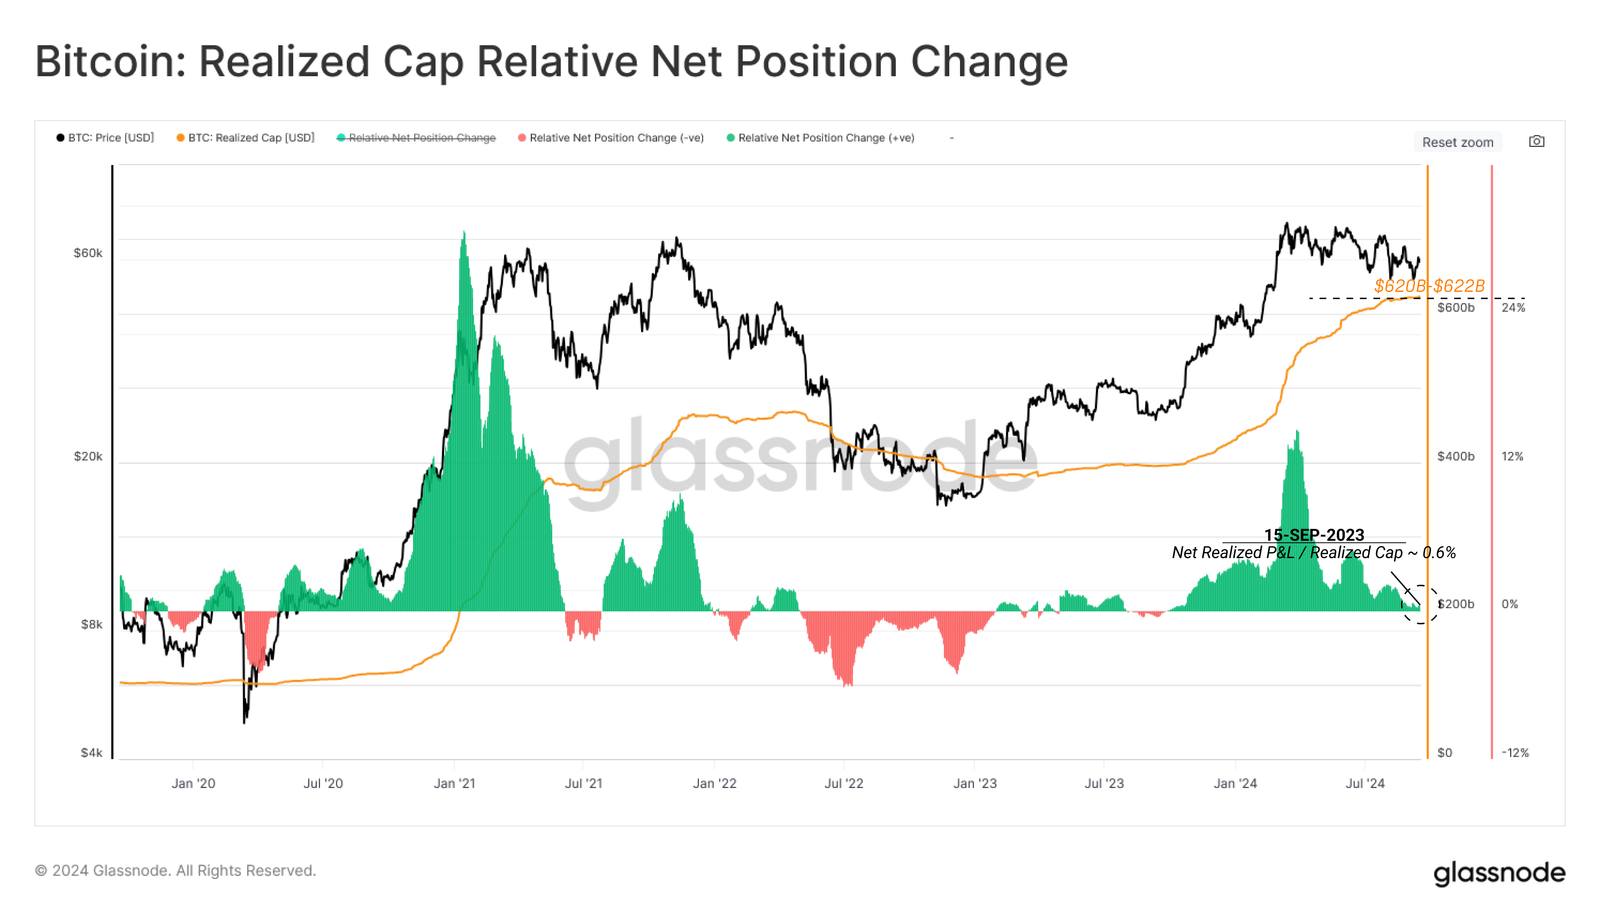
The Realized Cap is like Bitcoin’s bank statement—it tracks how much cash has come in and out of the network over time, but without a barrage of paperwork.
The market's been stuck in a six-month-long snooze fest, barely moving up or down, and it seems like both money coming in and going out decided to take a long coffee break.
The Realized Cap has found its comfy spot on the couch after it hit its peak and settled at $622B over the past two months.
This means most coins being traded are sticking close to their original price tags, not venturing too far from where they were first bought - just a bunch of bitcoiners playing it safe.
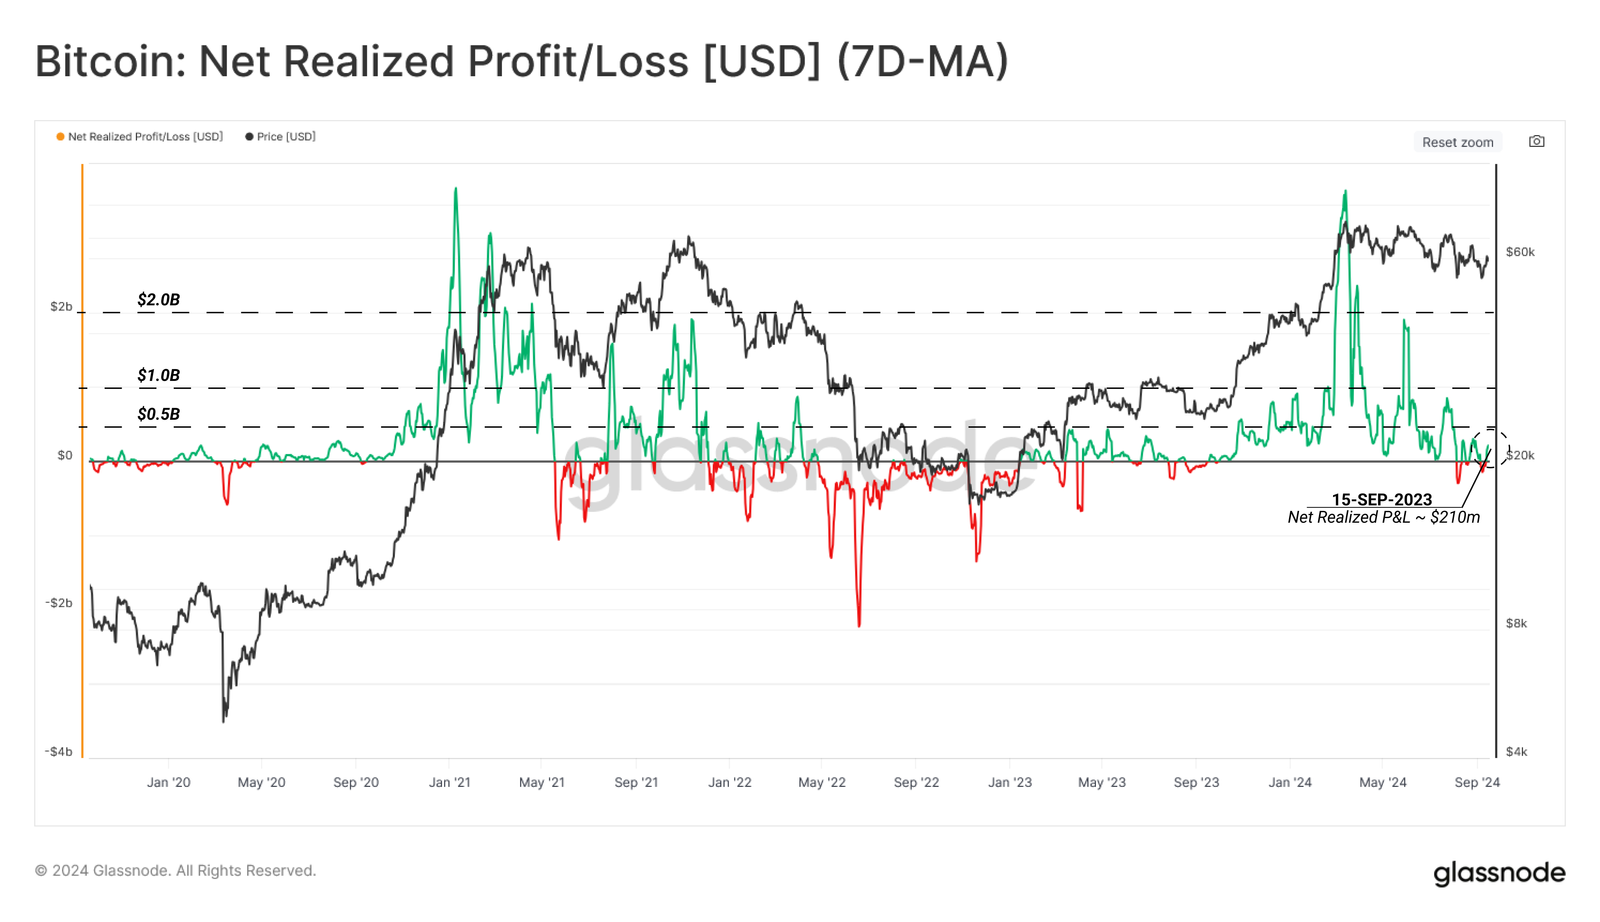
The Net Realized Profit/Loss metric shows the daily change in Bitcoin's onchain capital flow.
Positive values indicate capital creation (coins in profit), while negative values signal capital destruction (coins at a loss).
Currently, profit and loss forces are balanced, leading to marginal net flow and oscillation near zero—similar to the market equilibrium seen in Aug-Sep 2023.
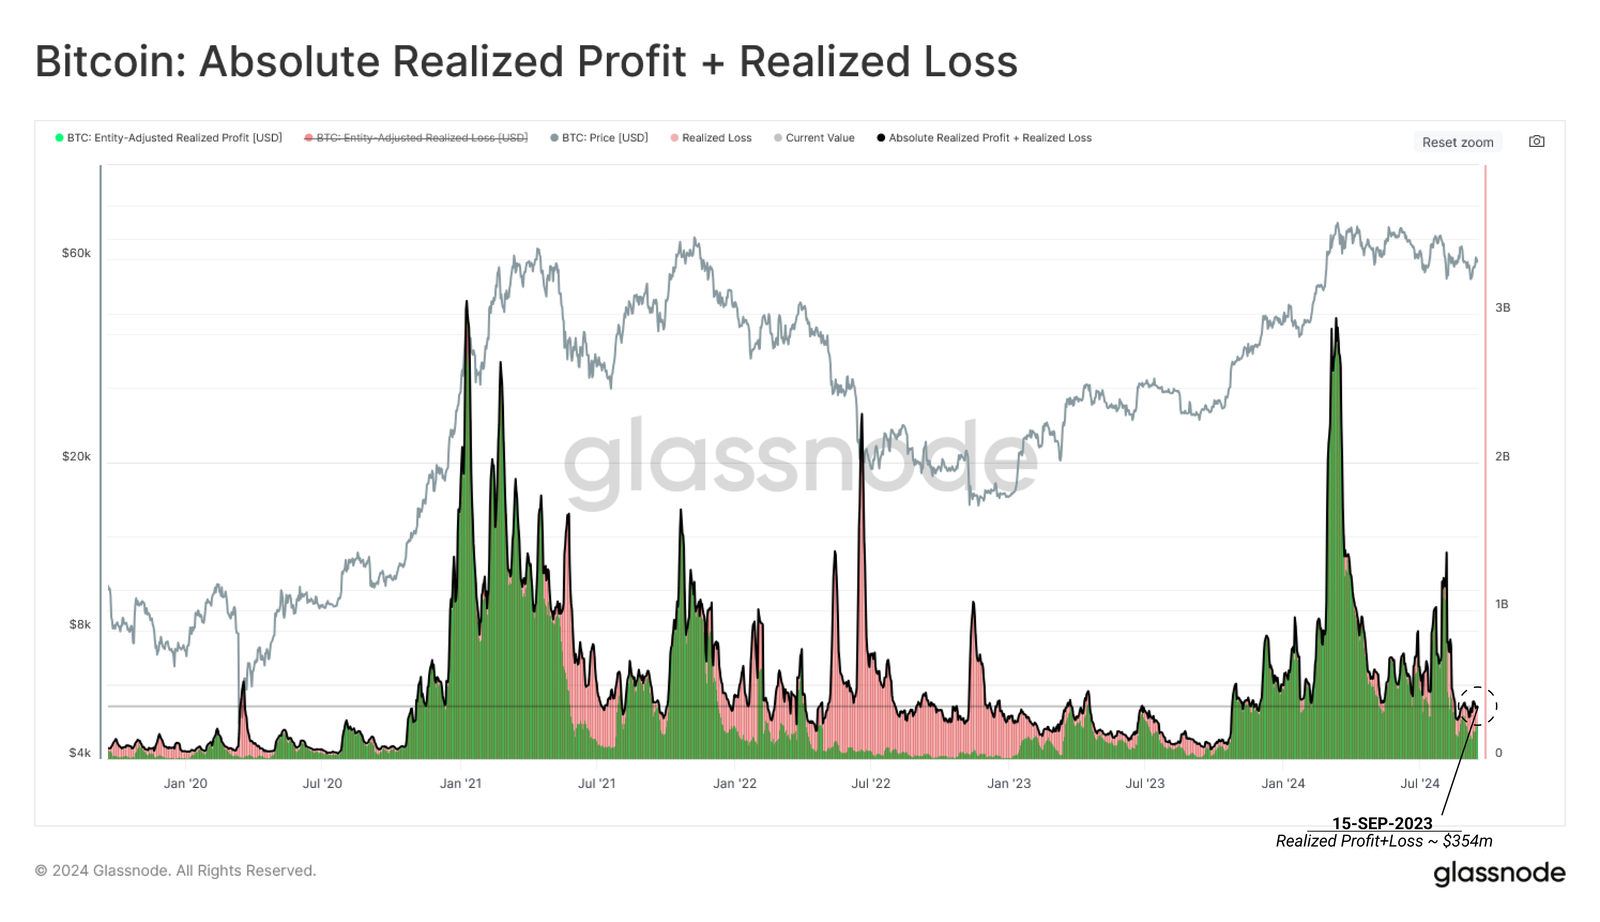
Realized Profit and Loss reflects the extra capital needed for a seller to part with their coin, serving as a proxy for market demand.
It suggests whether sellers are willing to transact at a profit (premium) or loss (discount).
Since the March ATH, the combined Realized Profit and Loss has dropped significantly, indicating reduced buy-side pressure in the current price range.
Bitcoin Market Sell-Side Pressure
After assessing market demand, it's crucial to examine supply metrics for a complete view of the short- and medium-term battle between bulls and bears; demand and supply.
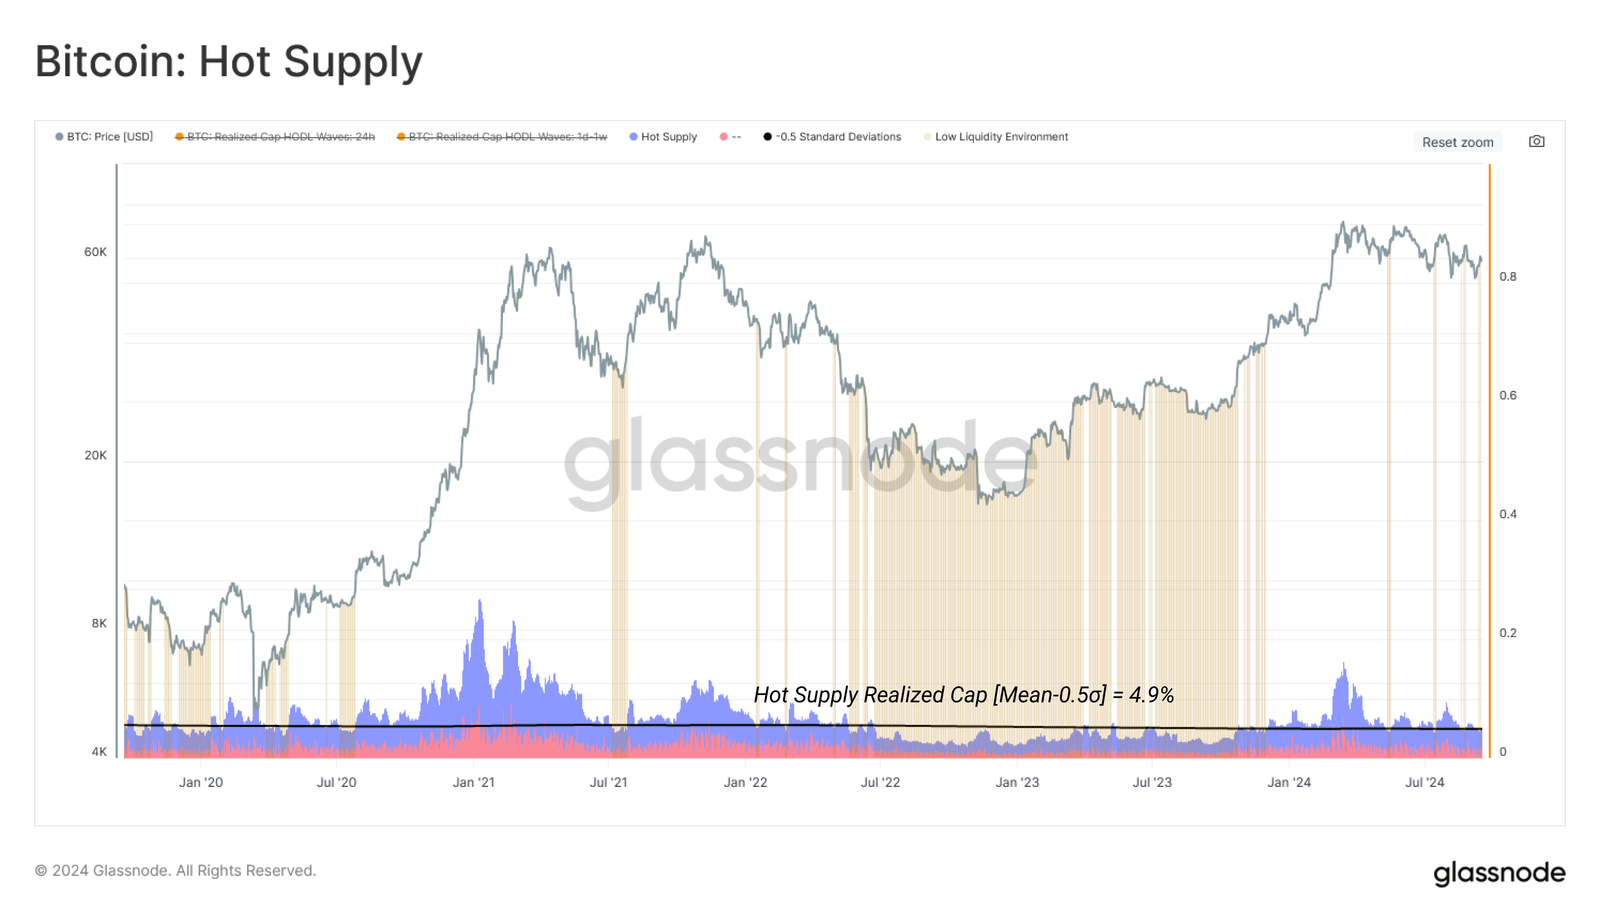
The 'Hot Supply' metric estimates coins likely to be traded, representing those held for one week or less.
Given their short holding time, these coins are more likely to move in response to market changes, making them a key indicator of market activity.
Coins held for less than one week now make up just 4.7% of the network's wealth, entering a low liquidity zone. This shows a tightening supply, with most coins held for longer periods.
The supply divergences chart tells a similar story. It compares 'available supply,' like Short-Term Holder and Highly Liquid supply, with 'stored supply,' such as Long-Term Holder and Vaulted supply.
HODLing behavior is dominant, driving a rapid increase in 'stored supply' and tightening the overall supply as fewer coins remain available for active trading.
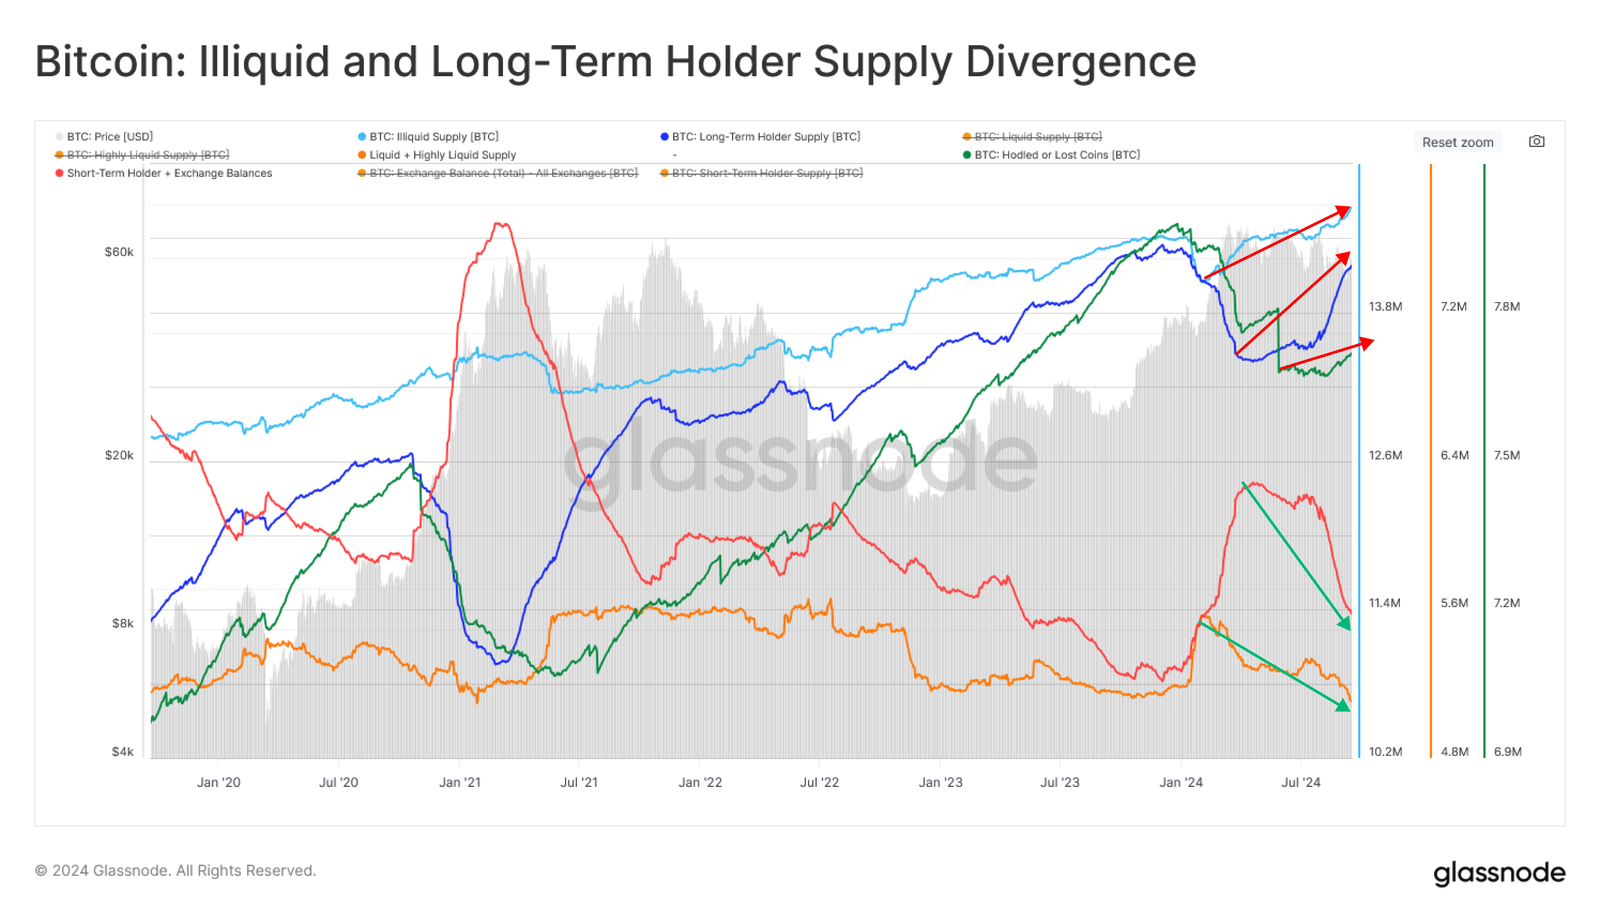
Source: Glassnode
What Does this Mean for Bitcoin’s Price? Well before we can have a clear answer for that, let’s look at stablecoins.
Stablecoins Supply
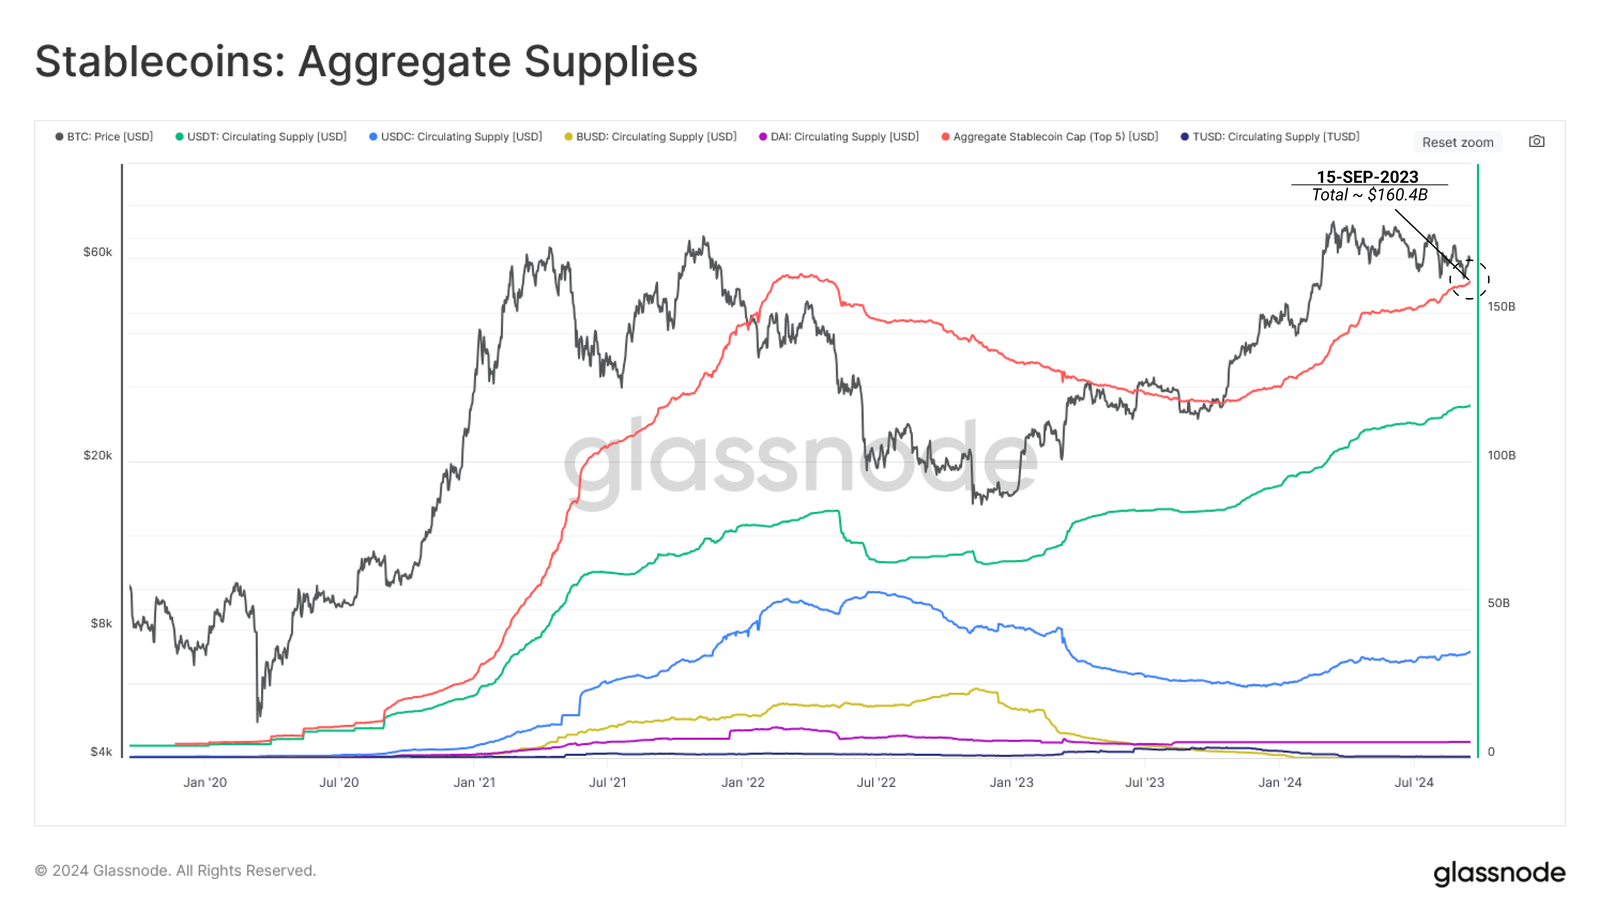
Stablecoins are the preferred quote currency on both centralized and decentralized exchanges, making their supply a crucial indicator for investor demand.
The total stablecoin supply is near its ATH at $160.4B, signaling a build-up of crypto-native capital. However, this capital isn't yet moving into riskier assets such as BTC.
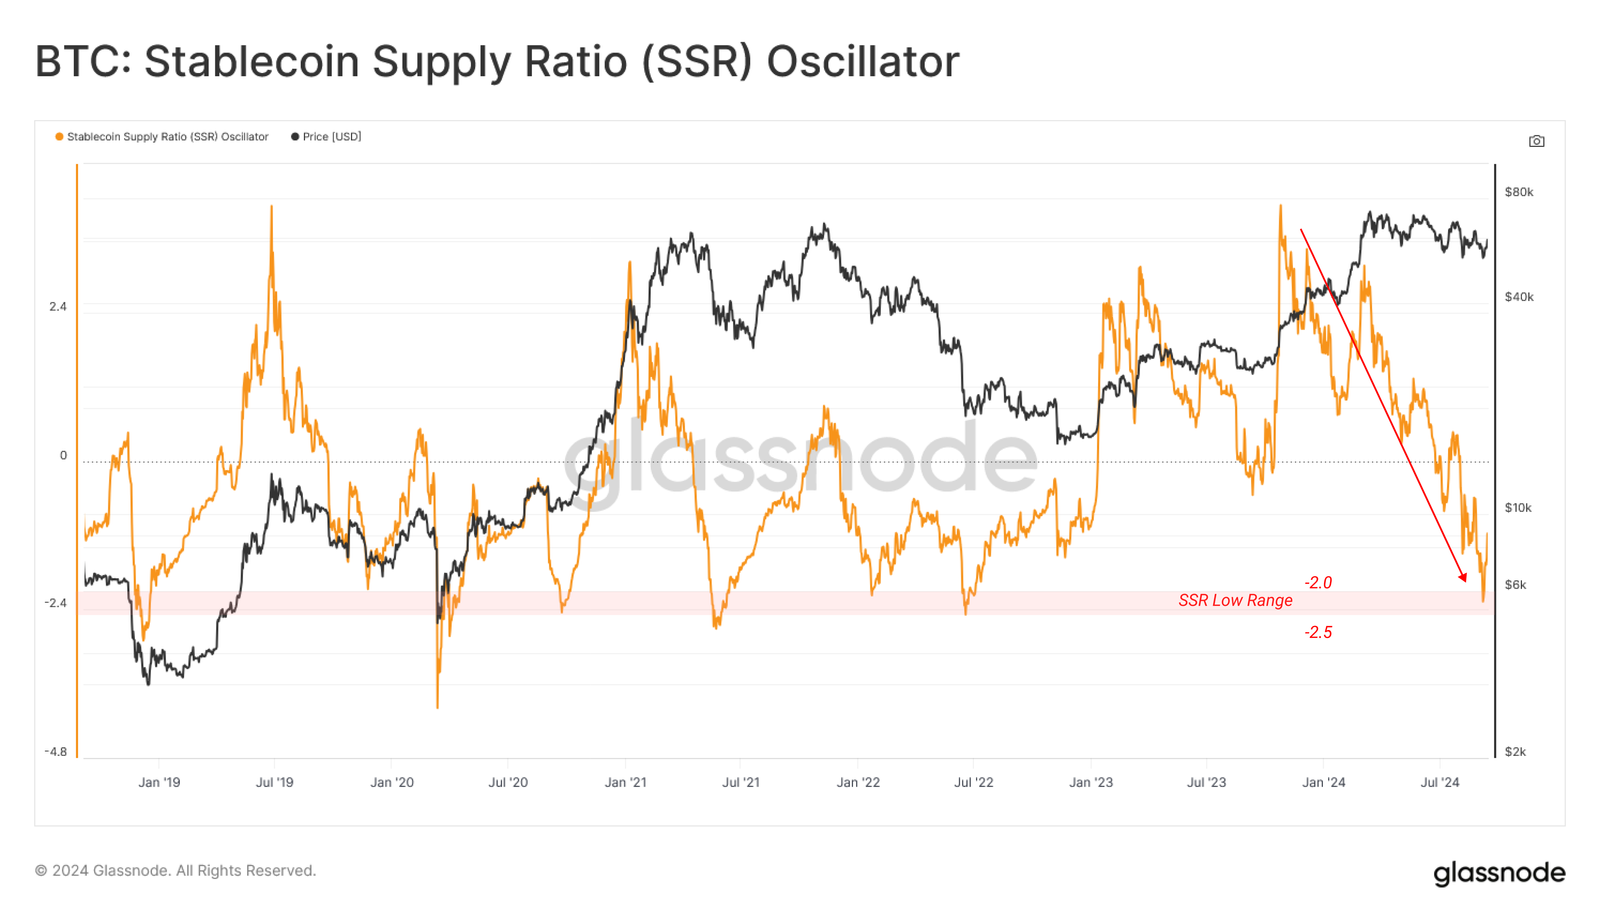
The SSR Oscillator compares Bitcoin's market cap to the circulating stablecoin supply. A low SSR means stablecoins have more "buying power" for BTC, while a high SSR means less.
With Bitcoin's market cap stable and the stablecoin supply growing, the SSR is at a historic low, indicating increasing buying power and potential future demand growth.
Bitcoin Price Prediction: Bitcoin’s Price in Relation to Onchain Activity
Bitcoin is currently at a key support level near the 20-day EMA ($58,639). If it falls below this, we could see further declines toward the triangle’s support line.
However, if bulls defend this level and the price rebounds, Bitcoin may rally past $62,000, with potential gains up to $65,000 and even $70,000.
just checked the crypto market pic.twitter.com/OLMtpBIPUy
— naiive (@naiivememe) September 19, 2024
Market equilibrium, slowing demand, and tightening supply suggest low activity for now, but rising stablecoin reserves hint at increasing future buying power, setting the stage for higher volatility and possible upward movement in the coming weeks.
Disclaimer: All materials on this site are for informational purposes only. None of the material should be interpreted as investment advice. Please note that despite the nature of much of the material created and hosted on this website, HODL FM is not a financial reference resource and the opinions of authors and other contributors are their own and should not be taken as financial advice. If you require advice of this sort, HODL FM strongly recommends contacting a qualified industry professional.