

Welcome to HODL FM, the only crypto publication that’ll keep blubbering about crypto to win your attention.
Brief spotlight on Ethereum’s market performance:
- Weekly price change for Ethereum (ETH): ETH price lost 7.23% over the last seven days after dropping from $2625 to $2431, at the time of writing.
- Ethereum (ETH) Market Capitalization: Ethereum's market cap dropped from $315 billion to $293 billion in the last one week.
As per on-chain insights from Into the Block, nearly a third of all Ether is now staked, a fact suggesting token holders are in it for the long haul and are aiming for the rewards that come with it. The on-chain data provider reported that 28.9% of all Ether is staked.
Back in January, only 23.8% was staked, meaning another 5.1% has been locked up over the past 10 months. See the chart in the tweet below:
🔍 Ethereum Update:
— IntoTheBlock (@intotheblock) October 8, 2024
🔐28.9% of all $ETH is now staked, up from 23.8% in January
💎Over 15.3% of staked ETH has been staked for more than 3 years
A strong signal of long-term confidence in Ethereum’s future. pic.twitter.com/HjUj2v9N1P
IntoTheBlock also pointed out that 15.3% of staked ETH has been locked up for more than three years. They see this as a clear sign of “long-term confidence” in Ethereum's future.
Read also: Vitalik Buterin Discusses The Importance of Solo Staking on Ethereum
ETH/USDT Price Analysis:
Ether (ETH), currently at $2,435.75, has been moving within a symmetrical triangle pattern this week, showing a lack of clear direction from both buyers and sellers.
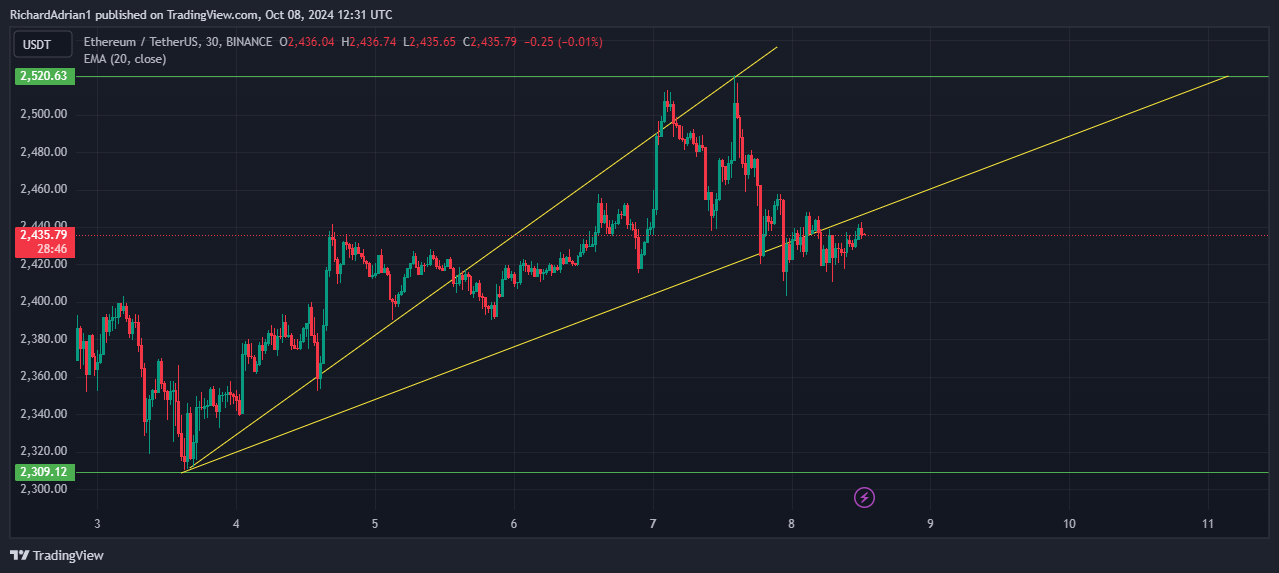
If the price goes above the moving averages, the ETH/USDT pair could rise to the resistance line. This is a key point for sellers to protect because if the price breaks through, it could jump to $3,400. There’s some resistance at $2,850, but it will likely be broken.
However, if the price drops sharply from the resistance line, it means the pair could stay in the triangle pattern for a while. For the downtrend to continue, sellers will need to push the price below the uptrend line.
ETH/USDT Relative Strength Index and the MACD
Looking at the technical indicators for ETH/USDT, the MACD and RSI provide some useful insights into the current market momentum.
The MACD shows that the blue line is at -2.57 and the orange line is at -4.49, with both lines trending upward. This upward movement suggests that bearish momentum is starting to weaken, and a potential bullish crossover could be on the horizon.
If the blue line crosses above the orange line, it would signal a possible buy opportunity, indicating a shift in sentiment.
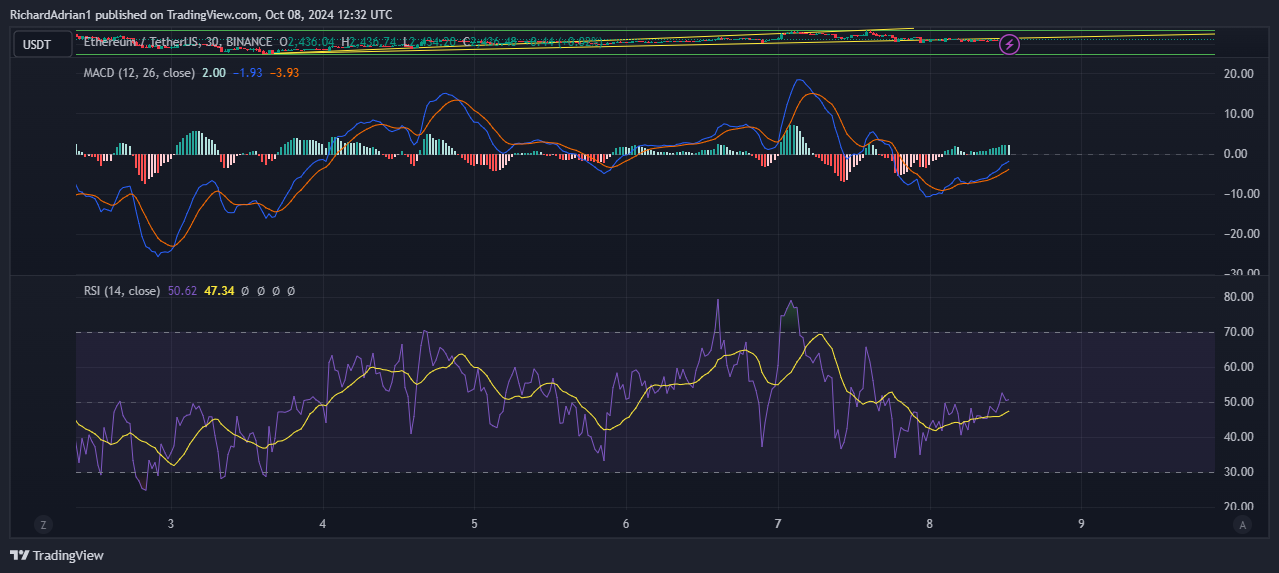
The RSI, sitting at 50.43, is also pointing upwards, signaling a neutral position but with a slight bullish bias. An RSI above 50 generally suggests that buyers are starting to gain control, though the market hasn't fully committed to either direction yet.
Taken together, these indicators suggest that ETH/USDT is in a phase of consolidation with a potential for upward momentum, especially if the MACD confirms a bullish crossover and the RSI continues to rise above the midline.
However, ETH remains inside the symmetrical triangle, and a break above resistance will be key for a clearer bullish trend.

Disclaimer: All materials on this site are for informational purposes only. None of the material should be interpreted as investment advice. Please note that despite the nature of much of the material created and hosted on this website, HODL FM is not a financial reference resource and the opinions of authors and other contributors are their own and should not be taken as financial advice. If you require advice of this sort, HODL FM strongly recommends contacting a qualified industry professional.