

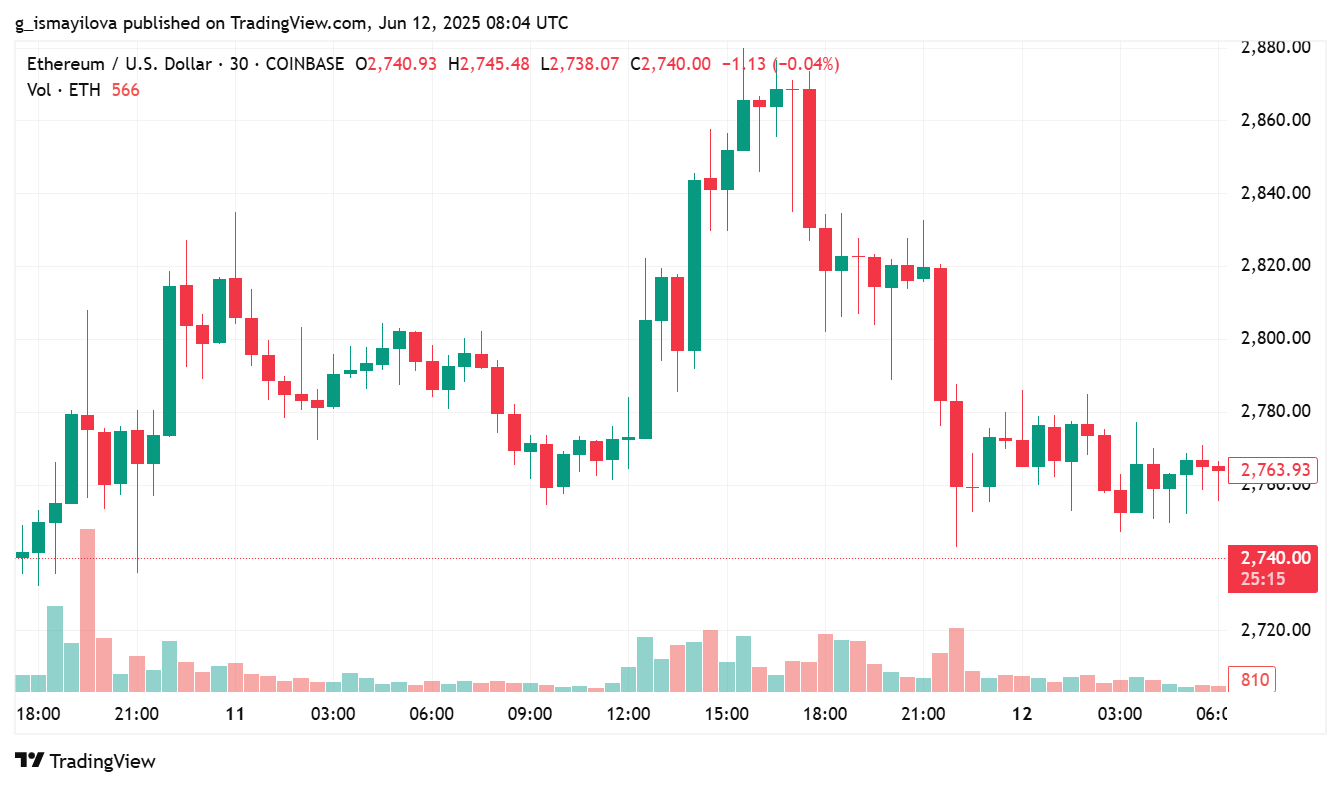
Ethereum is hovering around $2,746 at the time of writing, down 1.3% from yesterday but still rocking a 13% gain for the month. It’s been bouncing between $2,419 and $2,869 for the past week, which, in my opinion, shows just how tight the battle is between the bulls and the bears in this ever-changing market.
What’s keeping Ethereum on its feet? A big part of it is the hefty strength of spot ETF inflows. According to SoSoValue data, U.S. Ethereum ETFs saw a jaw-dropping $240.7 million in net inflows on June 11. That’s the biggest one-day haul in four months, and it marks the 18th consecutive day of positive flows. Talk about institutional interest! BlackRock’s ETHA led the charge, raking in $164.05 million, with Fidelity’s FETH and Grayscale’s mini ETH following closely behind. In total, the last 30 days have seen $700 million pour in. Impressive, right?
Bullish Options Market Signals
But it’s not just ETF inflows keeping ETH in the green. The options market is starting to show some serious bullish vibes. For those not in the know, options let traders bet on an asset’s price movement by giving them the right to buy (calls) or sell (puts) at a specific price. More calls being bought? That’s usually a sign that traders expect the price to go up.
From June 9 to 10, the ETH options skew took a sharp dive into negative territory, with the 1-week skew dropping from -2.4% to -7.0%. The 1-month skew also shifted from -5.6% to -6.1%, reflecting growing demand for calls over puts. I think this could be the calm before the storm; a price rally might just be on the horizon.
Taking a closer look at the technicals, Ethereum still shows signs of being in a bullish structure. The relative strength index (RSI) is at 63, creeping toward overbought territory, but it’s not there yet. ETH is still trading comfortably above its 10-day moving average of $2,658, as well as its 50- and 200-day averages, which hints at continued buying power.
Bollinger Bands have also widened, with Ethereum holding steady near the upper band, which usually means volatility is here to stay. And since May, ETH has consistently printed higher highs and higher lows, reinforcing the upward trend.
Can Ethereum Break $3,000?
So, what’s next for Ethereum? If the strong ETF inflows continue and the bullish options market keeps gaining steam, we could see ETH push for a retest of $2,900, with a possible breakout above $3,000.

However, if ETF inflows slow down and ETH drops below $2,700, we might see a pullback to around $2,600 or even test support near $2,400. My guess? It's still a wild ride, but the bulls are leading—for now.
 Richard Adrian
Disclaimer: All materials on this site are for informational purposes only. None of the material should be interpreted as investment advice. Please note that despite the nature of much of the material created and hosted on this website, HODL FM is not a financial reference resource, and the opinions of authors and other contributors are their own and should not be taken as financial advice. If you require advice. HODL FM strongly recommends contacting a qualified industry professional.