
Ever stared at a chart and thought: “There’s gotta be some logic in this chaos”? You’re not alone. Traders have hunted for patterns in price movements since markets began. And one pattern, drawn from a centuries-old sequence of numbers, keeps showing up in the strangest places, from sunflower spirals to crypto breakouts.
We’re talking about Fibonacci retracement.
If you’ve been trading for more than a week, you’ve probably heard someone throw around “Fibonacci levels” like they’re ancient wisdom, and in a way, they kinda are. Fibonacci trading is a powerful tool, especially when used with a bit of context and discipline. This guide breaks down Fibonacci retracement levels explained in plain language, without abstruse definitions and complex formulas. Just real talk about what they are, why they matter, and how you can use them.
You’ll learn how to draw Fibonacci levels, when to trust them (and when not to), and how they can become your secret edge, especially when paired with other tools.
The Fibonacci Sequence and Golden Ratio Explained
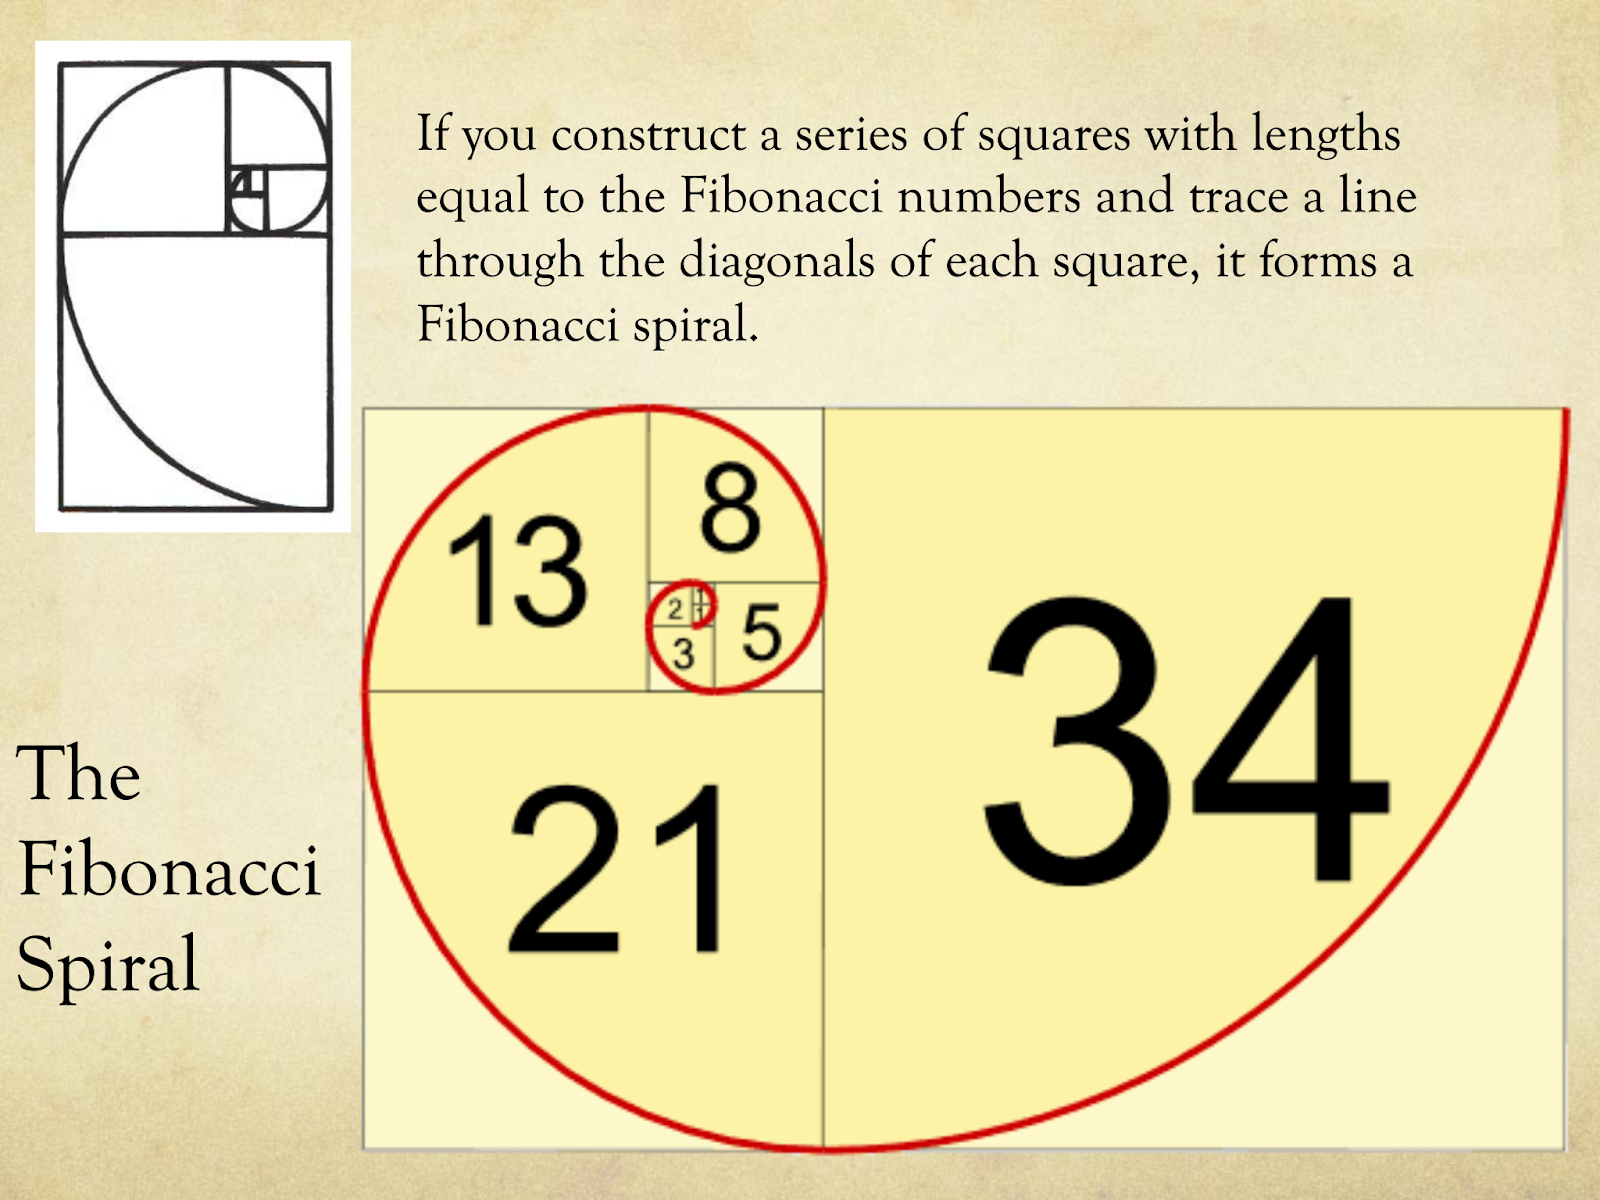
Before Fibonacci levels ever made it to a trading chart, they were just numbers. Seemingly simple ones, too. 0, 1, 1, 2, 3, 5, 8, 13, 21, and on it goes. Each number is the sum of the two before it. But here’s the twist: as you move further along the Fibonacci numbers list, something fascinating starts to happen. The ratio between the numbers begins to stabilize.
Divide 21 by 13. Then 34 by 21. Keep going. You’ll get something around 1.618, also known as the Golden Ratio.
Now, why does this matter to traders? Because this ratio shows up not just in math, but in the world around us, seashells, hurricanes, art, architecture, and yes, financial markets. The human brain, whether we like it or not, is drawn to proportion. And market movements, which are, ultimately, reflections of human behavior, follow patterns that often align with these ratios.
Interesting fact: the guy behind the sequence wasn’t named Fibonacci. His full name was Leonardo Bonacci or Leonardo of Pisa, a 12th-century mathematician who introduced the Hindu-Arabic numeral system to Europe. He wasn’t thinking about candlestick charts. But here we are, centuries later, using his work to map out trades.
What are Fibonacci Retracement Levels?
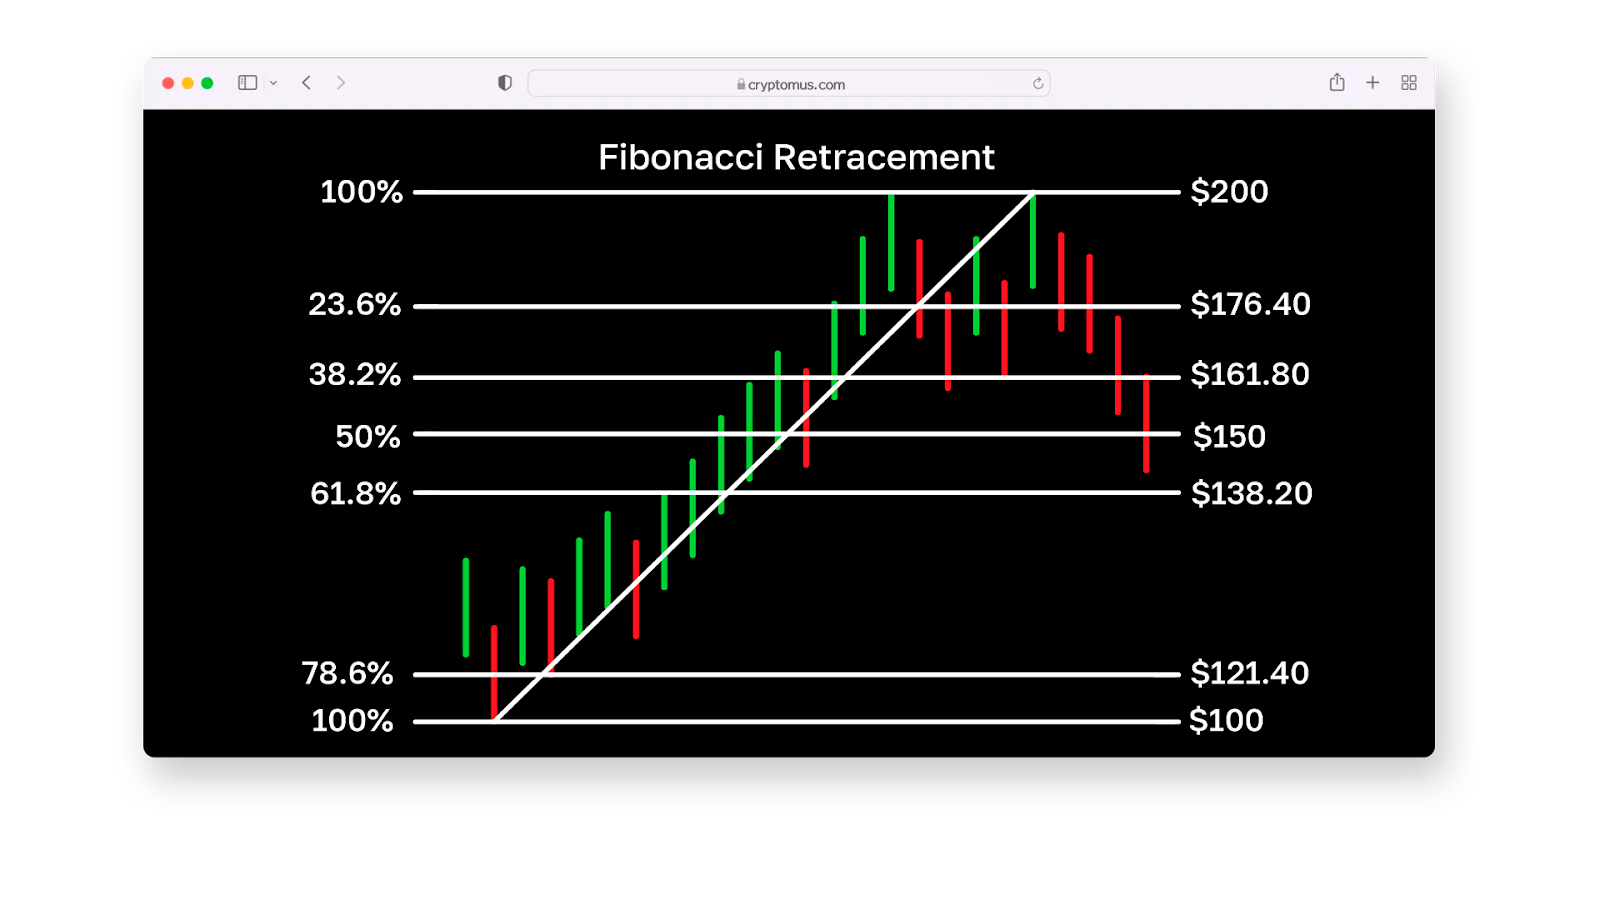
So let’s bring it back to trading. When we talk about Fibonacci retracement levels, we’re talking about potential turning points in a market, places where price might pause, reverse, or gather momentum.
The core retracement levels are: 23.6%, 38.2%, 50%, 61.8%, and 78.6%
Now, technically, 50% isn’t a true Fibonacci ratio, but traders include it anyway because markets often respect the halfway mark. The big one, though, is 61.8%. That’s the Golden Ratio in disguise. It’s where many traders look for prices to react after a move, especially in trending markets.
How do these levels get calculated?
Let’s say a stock jumps from $100 to $150. That’s a $50 move. A 61.8% retracement of that would be roughly a $31 drop (61.8% of $50), which would land us around $119. And if the market is truly bullish, it might bounce from that level and continue upward.
This is what makes Fibonacci retracement so useful. It turns raw price action into something you can actually map out, something visual.
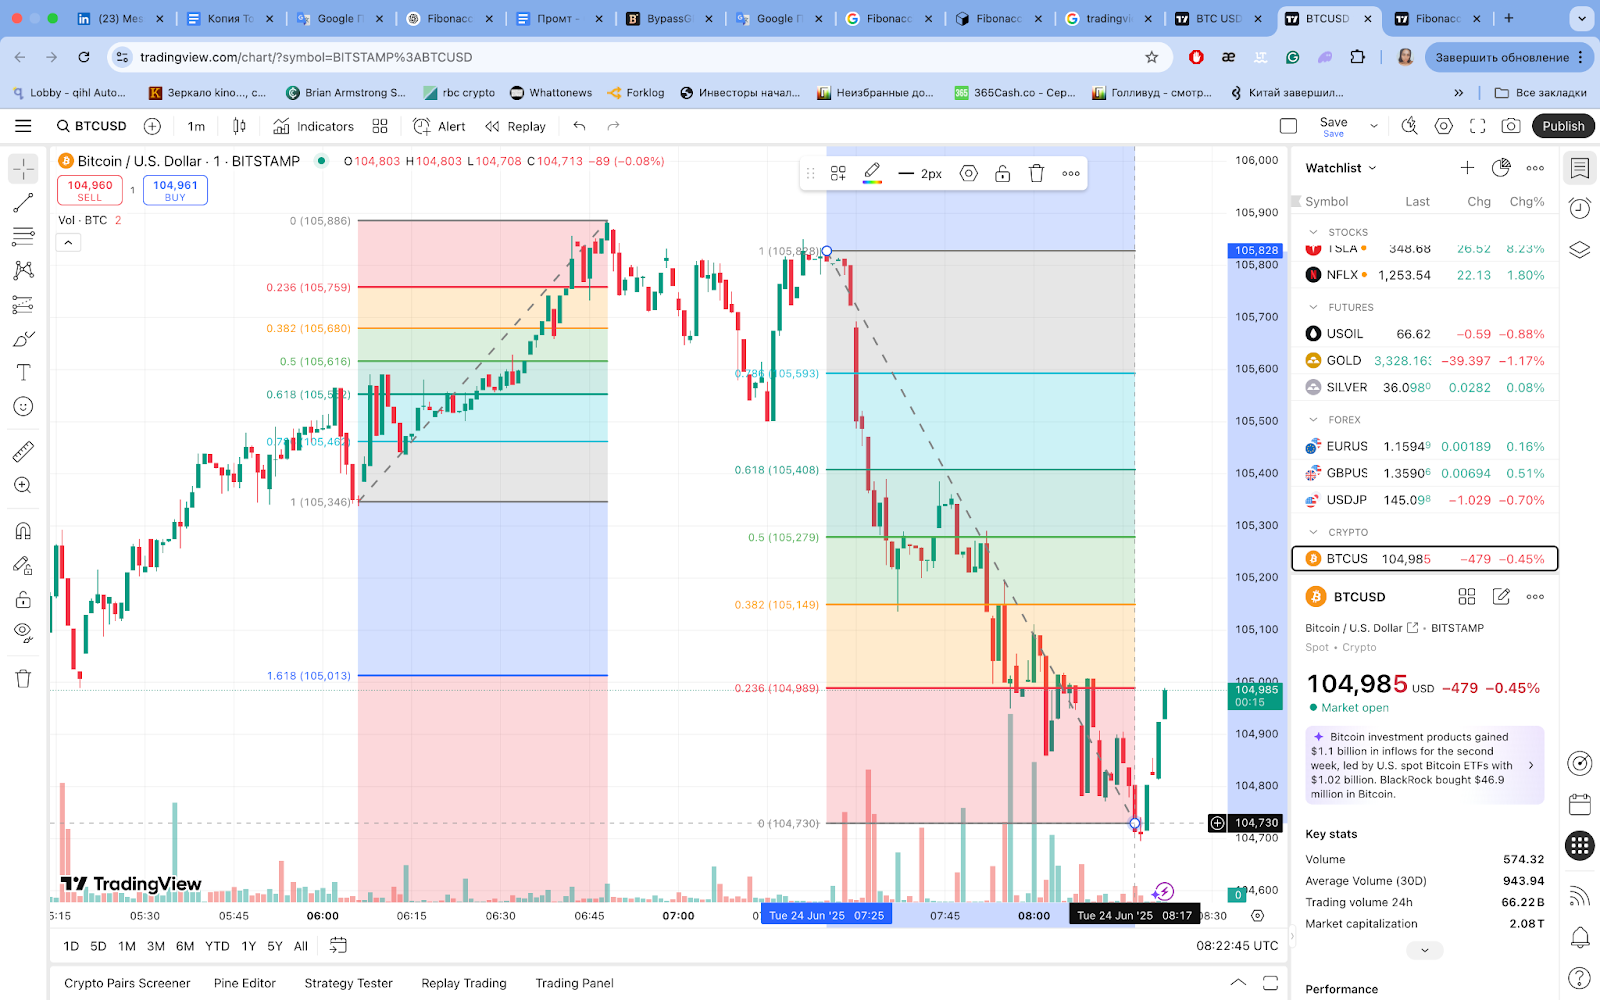
How to Draw Fibonacci Retracement Levels
Most platforms like MetaTrader4, TradingView, etc., offer a built-in Fibonacci tool. You don’t need to do the math by hand (thankfully), but it helps to know how to use it right.
To draw the Fib levels, identify a significant swing high and swing low. On an uptrend, draw from low to high. On a downtrend, high to low. The tool Fibonacci will automatically plot the key levels between those two points.
You’ll see lines at 23.6%, 38.2%, 50%, 61.8%, and so on.
Key levels and their significance:
- 23.6%: A shallow pullback in a strong trend.
- 38.2%: A common "buy-the-dip" level.
- 50%: A key level, often acting as support or resistance.
- 61.8%: The golden ratio, a significant level often considered a key decision point.
- 78.6%: The final leg of a retracement.
Some traders like to include extended levels like 161.8% or 261.8%, especially for projecting take-profits (more on that in a bit).
Which timeframe is best? That depends on your Fibonacci strategy. Scalpers might use 5-min charts, but if you’re looking for cleaner, more reliable setups, higher timeframes like the 4H or daily tend to filter out the noise. The Fibonacci retracement strategy works across all timeframes, but context is everything.
Practical Applications in Trading
Now you’ve got your Fib levels on the chart, what's next?
Let’s say you spot a strong uptrend. Price pulls back — naturally — and hits the 38.2% level. Volume slows, a bullish engulfing candle forms, and RSI starts ticking up. That could be your cue.
In this case:
- Entry might be at or just above the Fib level.
- Stop loss goes slightly below the next retracement level.
- Take profit near the recent high or the 127.2% extension.
Fibonacci retracement helps you define risk. It creates structure where otherwise there might just be guesswork. You’ll start to see price "follow" certain Fib levels, not always, but often enough to notice.
Some traders use Fibonacci retracement calculators to do the quick math, especially in fast-moving markets. Others rely on experience and screen time. Either way, it’s about pattern recognition, not prediction.
Combining Fibonacci with Other Technical Tools
Fibonacci in trading isn’t a standalone forecasting path. It works best when it confirms something else.
The Relative Strength Index tells you when a market is overbought or oversold. So what happens when price retraces to the 61.8% Fib level, and RSI hits oversold at the same time?
If price pulls back to the 61.8% Fib level and RSI says “oversold” at the same time, that’s a strong hint the drop might be ending.
Elliot Wave theory. Since wave patterns often correct in three moves (A-B-C), you’ll notice those corrections often align with Fib levels. Coincidence? Maybe. But profitable coincidence is still profit.
Traders also combine Fib levels with trendlines, moving averages, and even candlestick patterns like dojis (a candlestick that forms when the opening and closing prices are nearly the same).
Fibonacci Extensions - Taking Profits Further
Okay, so you’ve entered a trade. The price is moving in your favor. Now what?
This is where Fibonacci extensions come in, specifically, levels like 100%, 161.8%, and 261.8%. These act as potential profit targets.
Let’s say price went from $50 to $70 (a $20 move), retraced to $60 (61.8%), and is now climbing again. A 100% extension puts the target at $80. A 161.8% extension? Around $92.
These levels aren’t promises, they’re potential. But when you combine them with previous resistance zones or volume spikes, they become powerful exit signals.
Benefits and Limitations of Fibonacci Retracement
It’d be nice if Fibonacci levels worked every time. But let’s be real.
Pros:
- Universal tool, works across assets and timeframes
- Creates structure in fast markets
- Helps define risk/reward clearly
Cons:
- Can become a crutch if overused
- Doesn’t work well in choppy or low-volume marketsNeeds confirmation, otherwise, it’s just lines on a screen
Some days, price slices through all the levels like butter. Other days, it completely ignores them. You won’t know which is which until afterward, so don’t trade Fib alone.
Strategies for Success with Fibonacci
If you're just starting, don’t rush it. Look at higher timeframes, the daily or even weekly chart, and practice drawing Fib levels after big swings, see how the price reacted, and train your eyes.
Stick to clean trends. Use Fib levels to find pullback entries, but make sure the overall momentum supports the trade. Your stop should always be just beyond the level you're relying on. That way, if the market breaks through it hard, you're out before it gets horrible.
And don’t sleep on journaling. Screenshot your Fib setups. Record why you entered. Over time, you’ll build your own database of pattern recognition.
Conclusion
Fibonacci isn’t a magic spell. It’s a way of seeing rhythm in markets that sometimes feel random. Will it solve all your trading problems? Not a chance. But used wisely, it might just help you ask better questions, take better entries, and exit with a bit more confidence.
FAQ
Who was Fibonacci?
Fibonacci, also known as Leonardo of Pisa, was a 12th-century Italian mathematician who introduced the famous Fibonacci sequence to Western Europe. He wasn’t a trader, but his numbers found their way into the charts.
Does Fibonacci Retracement work?
Fibonacci retracement works, but not on its own. Fibonacci levels highlight areas of potential support or resistance, but they need confirmation from price action, volume, or indicators to be reliable.
What is the difference between Fibonacci retracement and extension?
Fibonacci retracement is used to identify potential reversal points during a correction. Fibonacci extension is used to project potential profit targets beyond the current move.
 Dayo Paul
Disclaimer: All materials on this site are for informational purposes only. None of the material should be interpreted as investment advice. Please note that despite the nature of much of the material created and hosted on this website, HODL FM is not a financial reference resource, and the opinions of authors and other contributors are their own and should not be taken as financial advice. If you require advice. HODL FM strongly recommends contacting a qualified industry professional.