
Elliott Wave Theory sits within technical analysis as a way to organize how prices unfold over time. It treats markets as patterned systems shaped by collective behavior, rather than as random or purely mechanical processes.
Analysts who work with the theory rely on structure and probability to make sense of price development, while accepting uncertainty as part of the process.
To understand Elliott Wave clearly, it helps to separate its original principles from the ways it is often simplified or overstated in modern commentary.
Origins of the theory
The theory is named after Ralph Nelson Elliott, an American accountant who began studying financial markets in the early 1930s. Elliott reviewed decades of price data across multiple timeframes, drawing from Dow Theory and from recurring structures he observed in natural systems.
He concluded that price movement often follows repeatable sequences driven by shifts in crowd behavior.
Elliott first outlined his ideas in The Wave Principle, published in 1938. His work gained attention after he identified a major market low in 1935, an example frequently referenced to show how structured analysis can clarify market conditions at turning points. Elliott described his work as a way to organize probabilities rather than as a method for precise forecasting.
Trends and corrective movement
Elliott Wave Theory distinguishes between directional movement and counter-movement. Prices advance or decline in recognizable sequences, then pause or retrace before the broader direction resumes.
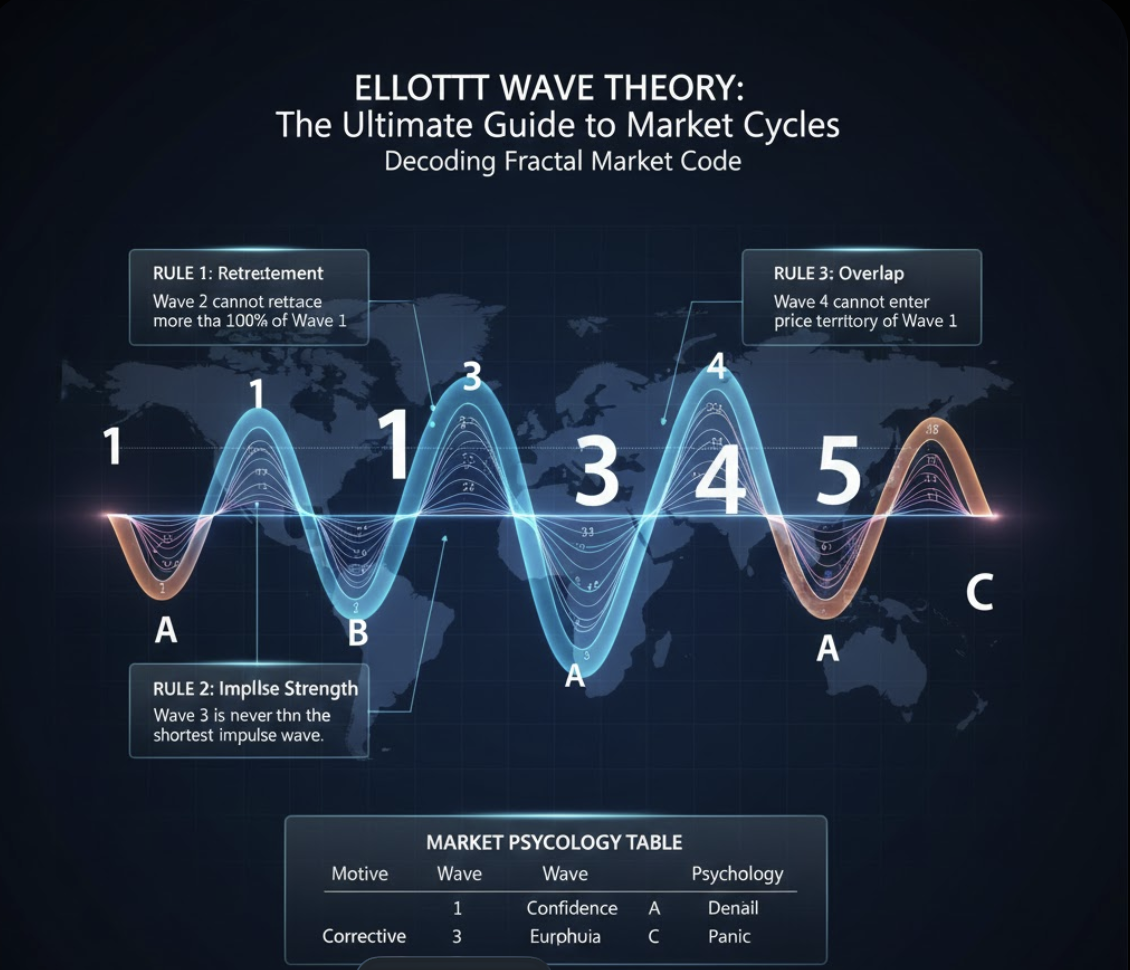
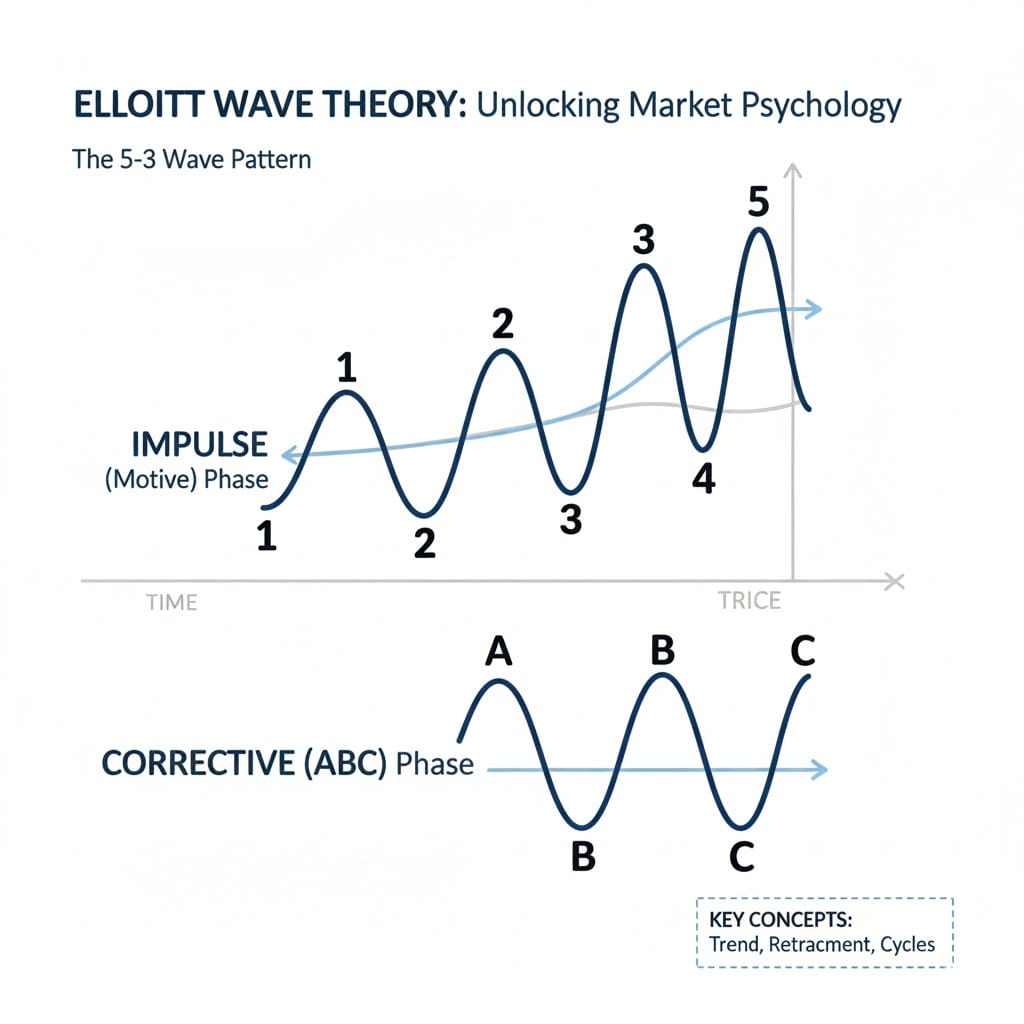
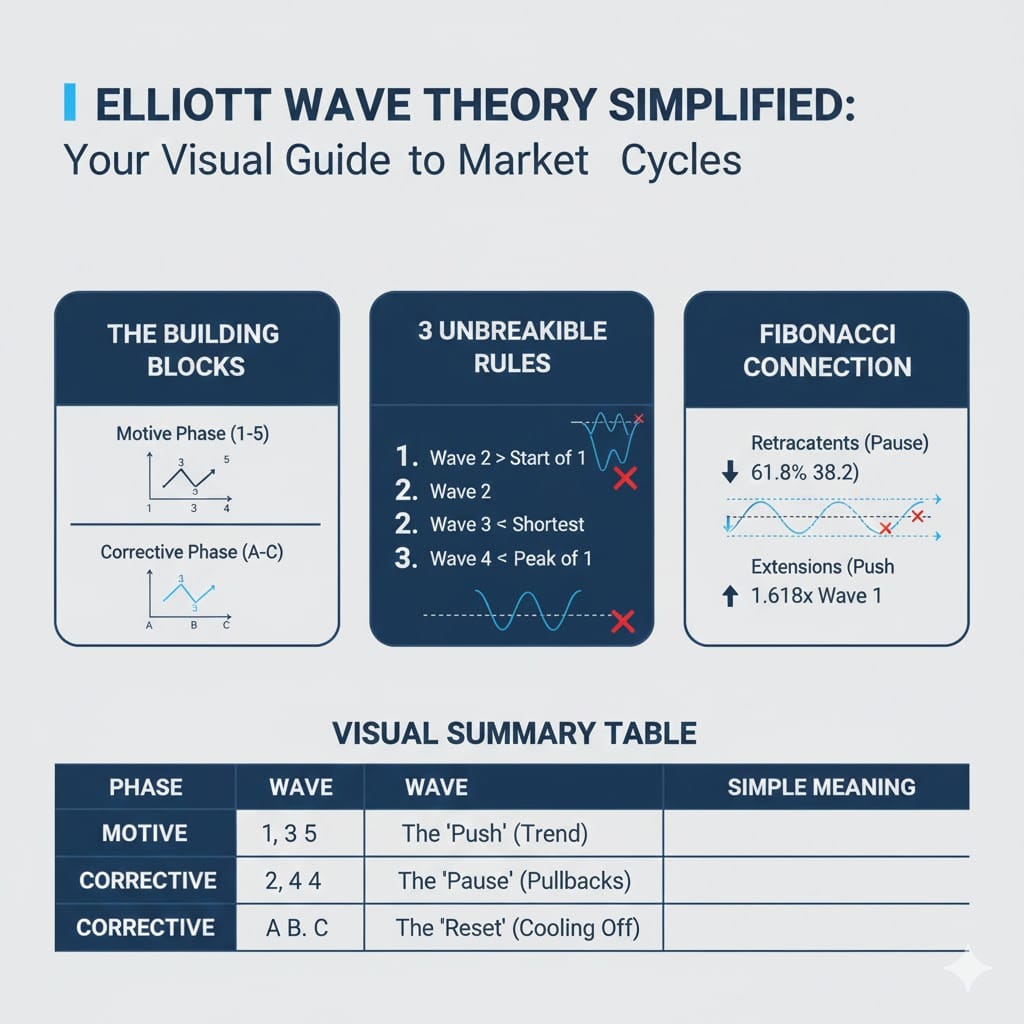
In the traditional model, movement aligned with the prevailing trend unfolds in five waves. These are known as motive or impulse waves. Movement against that trend usually takes the form of a three-wave correction.
These structures appear on all timeframes, whether observed on long-term charts or short-term price data.
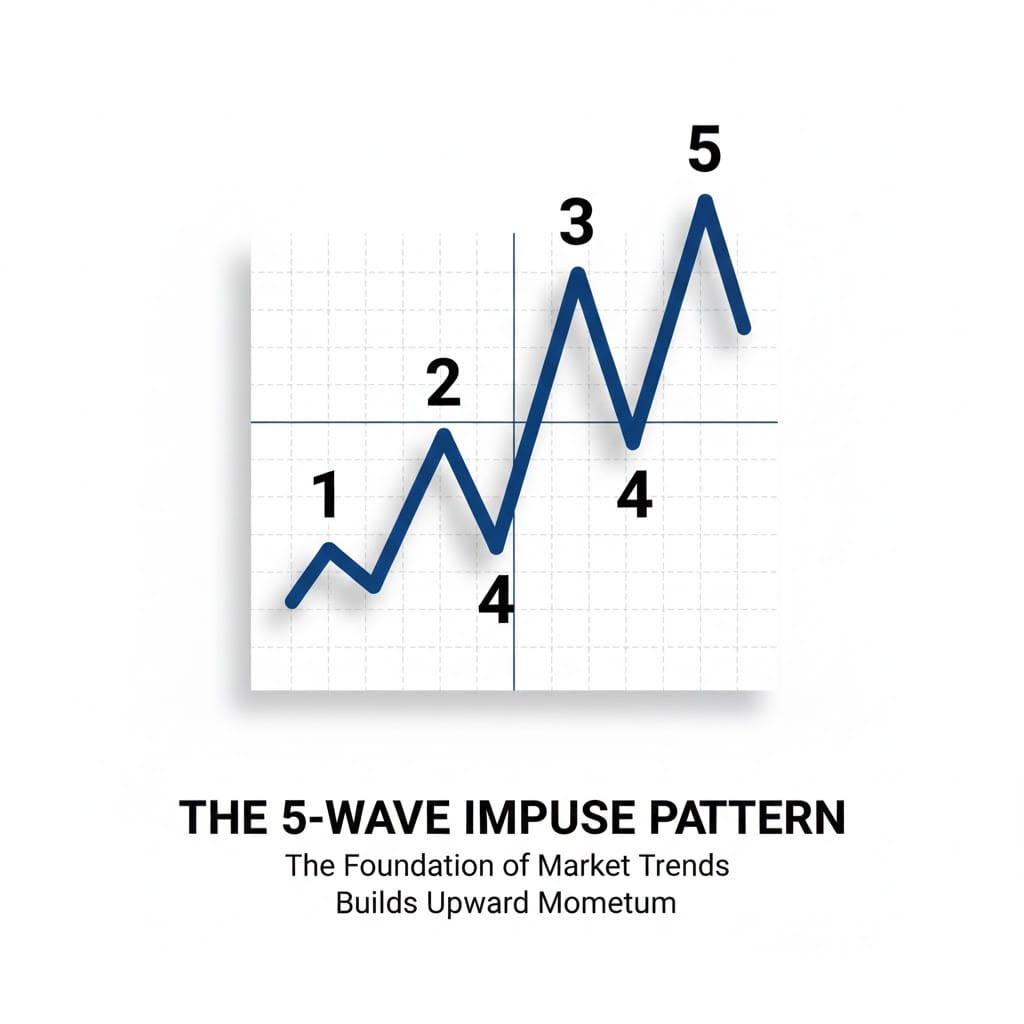
A five-wave advance includes three directional segments separated by two pullbacks. The advancing segments are labeled waves 1, 3, and 5, while waves 2 and 4 mark temporary retracements. Corrective phases unfold as waves A, B, and C.
These labels describe behavior rather than prescribe action. The framework helps analysts assess where price may sit within a broader sequence.
Fractals and wave degree
Elliott observed that market patterns repeat at different scales. Smaller wave formations resemble larger ones, allowing short-term price action to form part of longer-term structures. This fractal behavior explains why multiple interpretations can coexist without contradiction.
To manage this layering, Elliott introduced wave degrees. These degrees describe relative scale, ranging from multi-year cycles to short-term fluctuations visible on intraday charts. Analysts use wave degree to place current price action within a larger context rather than to imply importance or finality.
This layered structure explains why Elliott analysis often differs between practitioners. Each analyst may focus on a different timeframe while examining the same market.
Impulse waves in real markets
Impulse waves follow strict structural rules. Wave 3 cannot be the shortest of the advancing waves. Wave 2 must not retrace the entire length of wave 1. Wave 4 must remain outside the price territory of wave 1 in standard impulse formations.
When these conditions fail, the wave count must be revised. This requirement encourages ongoing reassessment as price evolves. In live markets, impulse waves rarely appear clean or symmetrical. Overlaps, extensions, or periods of consolidation often blur the structure.
As a result, experienced analysts focus less on perfect labeling and more on whether price behavior broadly aligns with impulsive characteristics, such as sustained momentum and shallow pullbacks.
Impulse waves describe price movement that aligns with the dominant trend at the next higher degree. They typically unfold in five sub-waves, capturing the market’s primary push in that direction.
Corrective structures and variability
Corrective waves present greater complexity. While they are often described as three-wave patterns, corrections can combine into extended or sideways structures that lack clear direction.
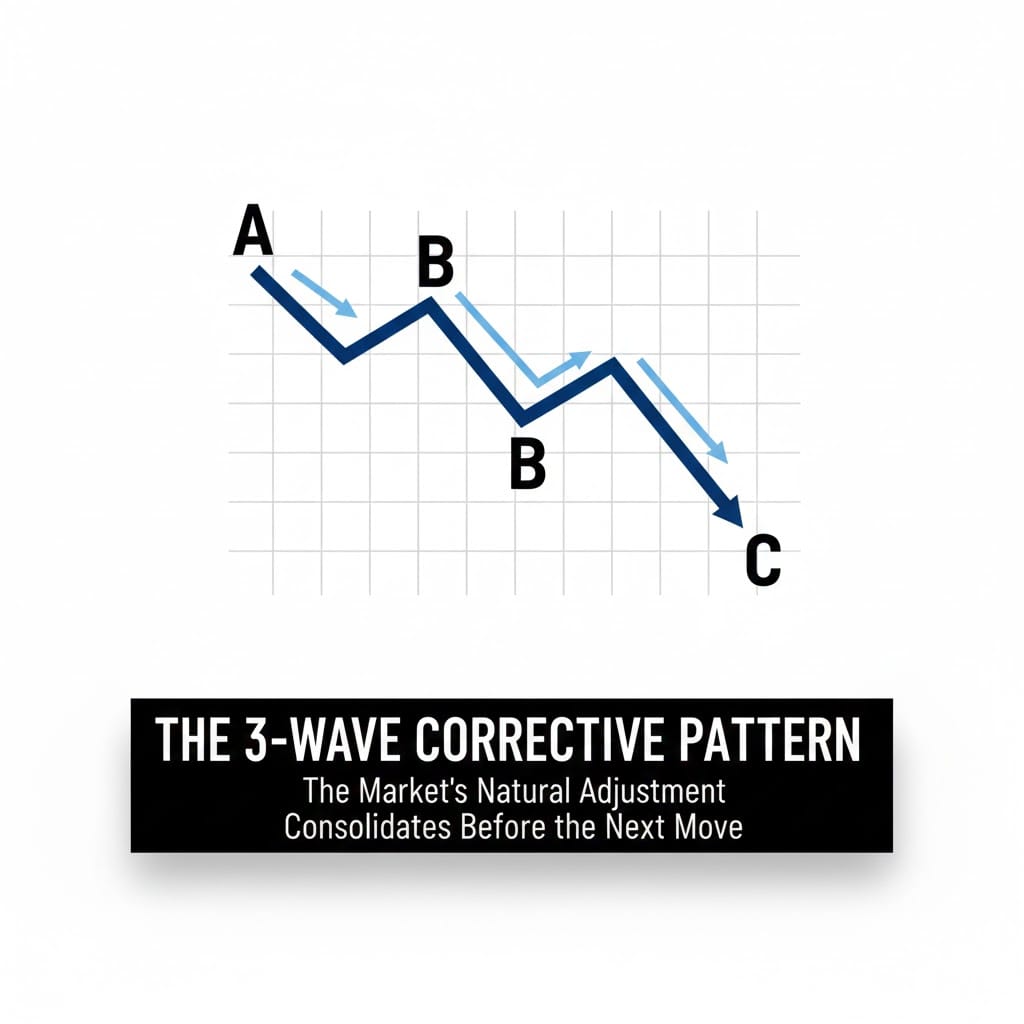
A basic correction begins with a counter-trend move, followed by a partial retracement and a final movement in the corrective direction. Variations include zigzags, flats, and diagonal formations. Diagonals often appear near trend exhaustion or during early trend development and may contain internal structures that differ from standard impulses.
This variability contributes to the subjective reputation of Elliott Wave analysis. Interpretation depends heavily on context rather than rigid pattern matching.
Corrective waves represent price movement that runs counter to the prevailing trend at the next higher degree. They most often unfold as three distinct sub-waves, reflecting a pause or adjustment rather than a reversal of the broader direction.
Market behavior and repetition
Elliott Wave Theory is grounded in behavioral observation. Markets advance as confidence builds and participation expands. Corrections emerge as expectations become stretched or uncertainty increases. These tendencies shape recurring price structures over time.
Even in markets dominated by automated execution, human behavior remains embedded in system design, risk parameters, and responses to information. Algorithms execute strategies, but those strategies originate from human assumptions about momentum, valuation, and volatility.
For this reason, wave-like behavior continues to appear across asset classes, including equities, currencies, commodities, and fixed income markets.
Fibonacci relationships in context
Elliott noted that wave relationships often align with ratios derived from the Fibonacci sequence. Retracements frequently cluster near commonly observed percentage levels. Extensions can also show proportional relationships to earlier waves.
When used flexibly, Fibonacci measurements support scenario analysis. When applied rigidly, they can distort interpretation, to estimate the likely extent of a wave within a larger structure.
The theory holds that waves tend to relate to one another in proportional ways, and Fibonacci measurements provide a practical framework for assessing those relationships.
In a typical impulse sequence, these proportional tendencies often appear as follows:
- Wave 2 retraces a portion of wave 1, frequently around 50%, 61.8%, 76.4%, or, in deeper corrections, close to 85.4%.
- Wave 3 often extends well beyond wave 1, with 161.8% of wave 1 being a commonly observed relationship.
- Wave 4 tends to be more shallow, frequently retracing roughly 14.6%, 23.6%, or 38.2% of wave 3.
- Wave 5 may extend by an inverse relationship of about 1.236 to 1.618 relative to wave 4, match the length of wave 1, or measure approximately 61.8% of the combined distance of waves 1 and 3.
Elliott wave in modern markets
Today’s markets differ significantly from those Elliott studied. High-frequency execution, global participation, and continuous trading have altered volatility patterns, particularly in foreign exchange and derivatives markets.
One practical adjustment is recognizing that trends do not always unfold as textbook five-wave sequences.
In some markets, price advances through repeated corrective structures that continue in the same direction.
Effective Elliott analysis avoids forcing every move into a predefined pattern. The emphasis shifts toward identifying directional intent and structural behavior as price develops.
Strengths, limits, and disciplined use
Elliott Wave Theory functions best as an analytical framework. It helps structure market observation, define alternate scenarios, and establish points where an interpretation becomes invalid. It performs poorly when treated as a standalone decision system.
Wave counts evolve as new price information appears. This adaptability reflects uncertainty rather than analytical failure. Practitioners who accept this often combine Elliott analysis with volume data, momentum measures, or broader market context to strengthen their conclusions.
The theory provides structure and perspective while leaving execution and risk management to the analyst.

Disclaimer: All materials on this site are for informational purposes only. None of the material should be interpreted as investment advice. Please note that despite the nature of much of the material created and hosted on this website, HODL FM is not a financial reference resource and the opinions of authors and other contributors are their own and should not be taken as financial advice. If you require advice of this sort, HODL FM strongly recommends contacting a qualified industry professional.