
When Bitcoin reached $100,000 for the first time on December 4, 2024, it felt like a worldwide holiday. News of this has even reached people who are uninterested in cryptocurrency.
What was the reason for this rapid price rise?
It’s the Bitcoin Banana Zone. Surprised by the weird term? No worries. In this article, we will explain what it is, what about bananas, and how it influences traders worldwide.
What is the Bitcoin Banana Zone?
Bitcoin Banana Zone is that sudden bitcoin price hike that multiplies the price several times and surprises humanity. To put it simply, it's when "Bitcoin goes to the moon".
For example:
- In 2013, Bitcoin jumped from $100 to $1,000 in a few weeks.
- In 2017, the price surged from $5,000 to $20,000 in months.
- In 2024, Bitcoin made a leap from $20K to $69K.
The Origin of the Term and Its Significance
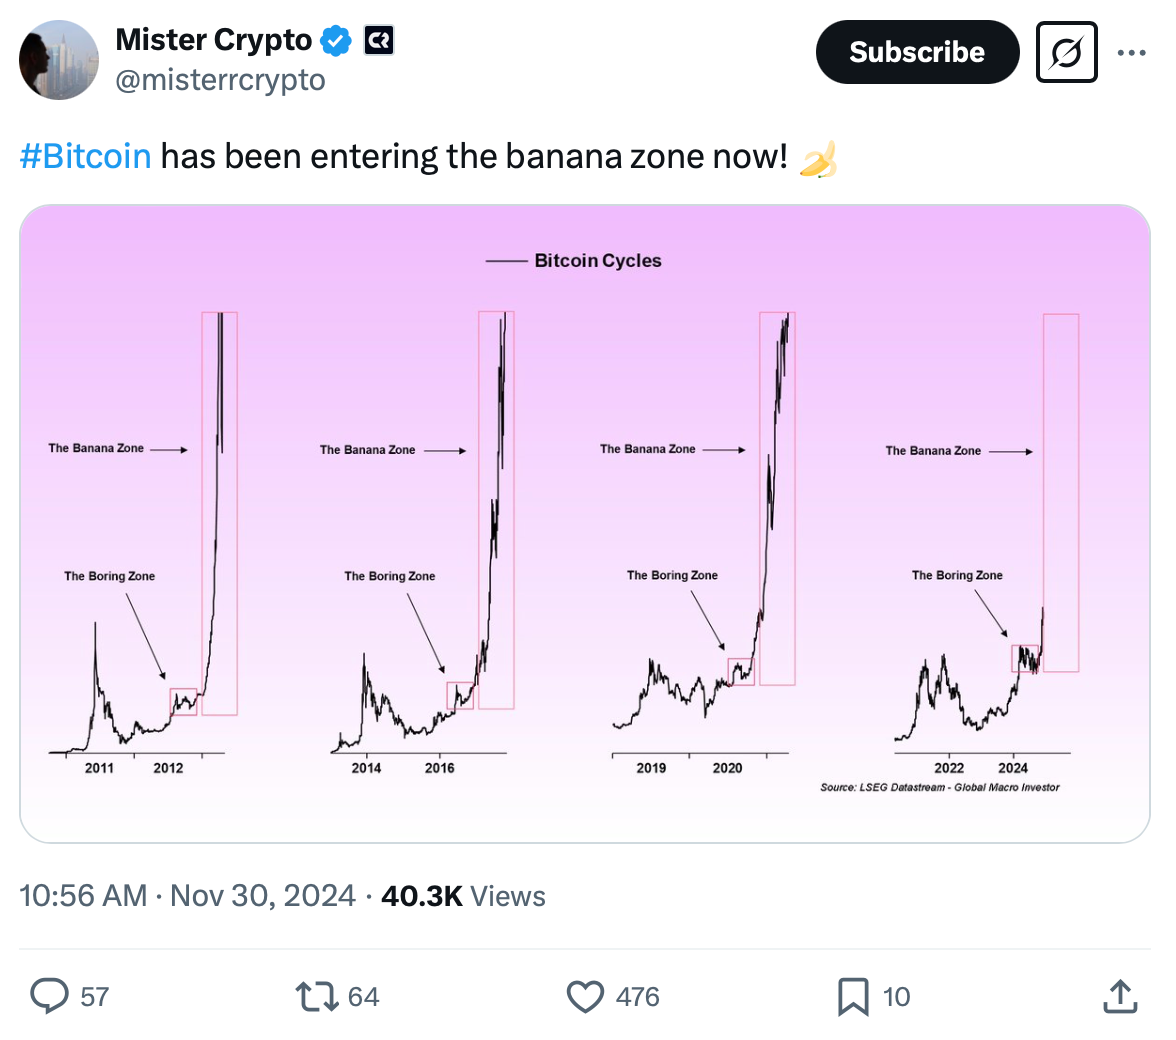
Raoul Pal, founder and CEO of Global Macro Investor, and RealVision, former hedge fund manager, conducted a thorough Bitcoin price analysis and developed the concept of Bitcoin Banana Zone.
If we look at the chart, we will see that the bitcoin price not just sharply goes up but with such consolidation that it resembles a banana tail. Or in mathematical language – parabola.
This figure consists of three Bitcoin market cycles:
- Breakout: it starts going up steadily but slowly with consolidations.
- Banana Zone: explosive move up.
- Market cooling: Bitcoin price trends stabilize or decrease.
Why does it happen like this? It is caused by market structure – Bitcoin bull and bear markets cycle, and human psychology.
At some moment, purchases are starting to exceed sales. Whales and institutional investors build up their positions. And then the media, followed by retail investors, start bringing the market to a boil.
How the Banana Zone Affects Bitcoin Traders
Let's consider in detail what happens during Bitcoin market phases and how the traders react.
During the breakout phase, whales accumulate their positions, the media coverage is low, and retail traders are uninterested.
While the gold Banana Zone – FOMO catches up with everyone. Price rise becomes vertical. Bitcoin support and resistance levels don't work anymore. Bitcoin influences cryptocurrency market trends. Happy time.
In the end, the Bitcoin market is cooling, which is the least favorite part of all traders. On the one hand, it's a time to take profits; on the other hand – not everyone can do it to the best advantage as it's impossible for everyone to do it at the same time.
Whales start selling Bitcoin, which causes price drops and volatility.
The point about greed and fear index shows 10 – that means panic. A lot of people start to sell. If an investor has bitcoin on the spot, it won't sell and would wait for the next rise. But if a person took it in the future, they would sell it not to lose too much but to lose all the same or even get liquidation.
Key Indicators and Metrics to Watch
First of all, we look at the chart. And how do we know where we are exactly right now? Here, Bitcoin trading indicators will help us. Firstly, we can use RSI and MACD from Tradingview.
RSI helps identify overbought and oversold conditions:
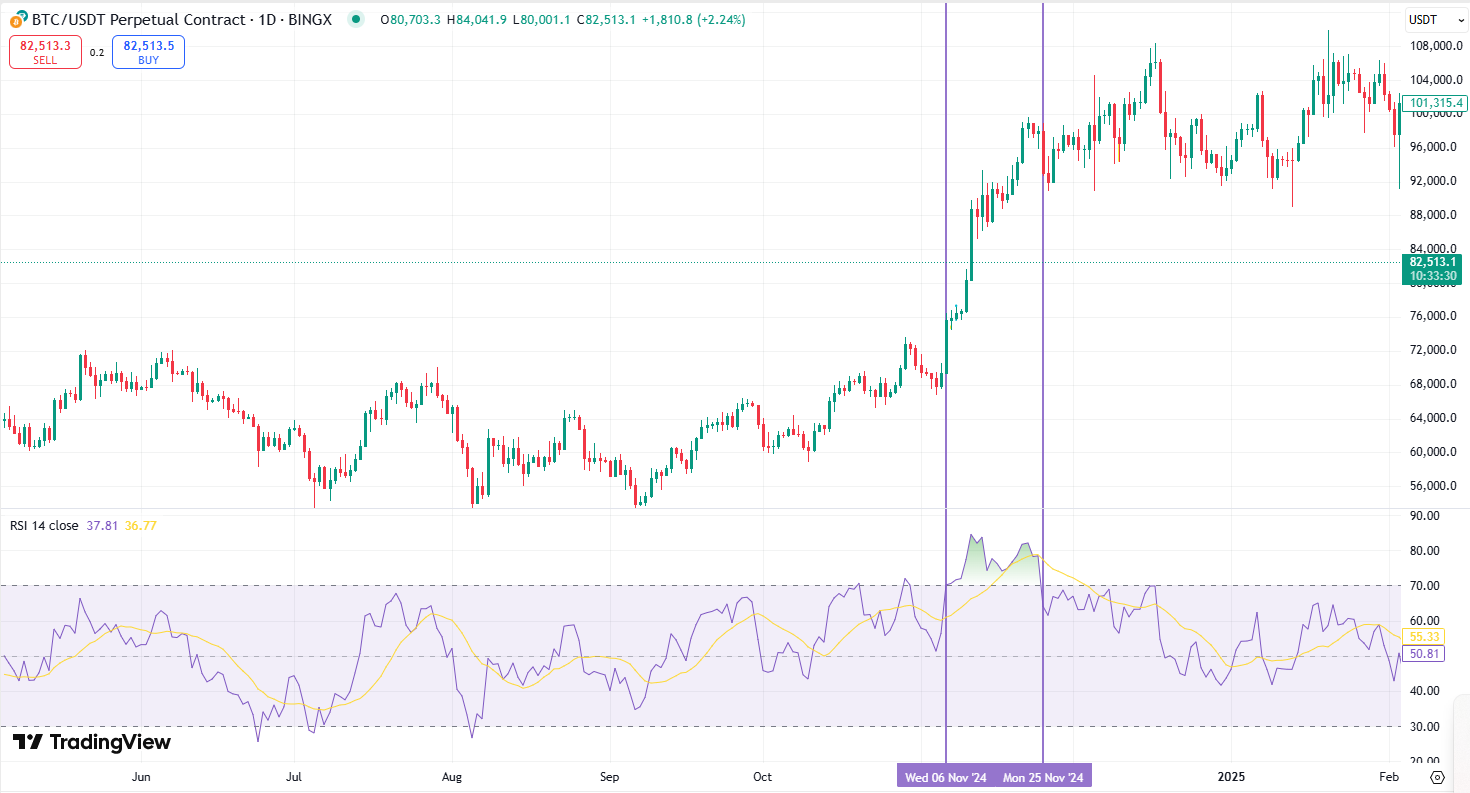
In November 2024, when there was an upswing, the indicator rose above 70. This indicates an overbought zone, which means that consolidation is not far away.
Moving Average Convergence Divergence (MACD) helps identify the best possible entry point for selling or buying. When the price on the chart and the MACD values have opposite trends, that means divergence. It always leads to price trend change.
Here is one of them on the chart:
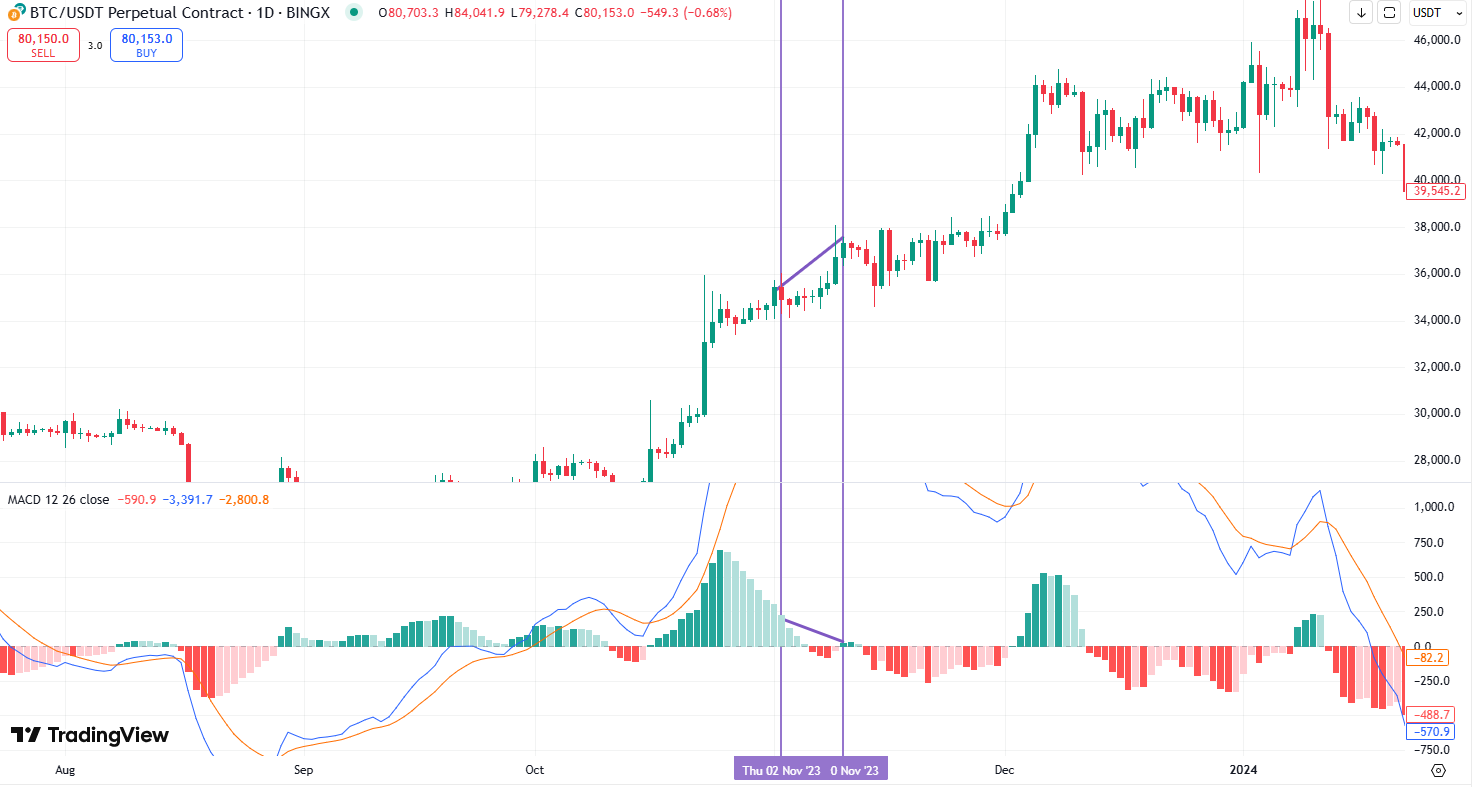
As you can see here, green candles become higher; however, MACD shows the opposite. After that, we see a small trend reversal – the price falls.
Besides this, try the metric explicitly created for Bitcoin – MVRV Z-score. According to BitcoinMagazine, MVRV Z-Score is a bitcoin chart that uses blockchain analysis to identify periods where Bitcoin is extremely over or undervalued relative to its 'fair value.'
Its formula is:
MVRV-Z Score = (circulation market capitalization – realized market capitalization) / Standard Deviation (circulation market capitalization)
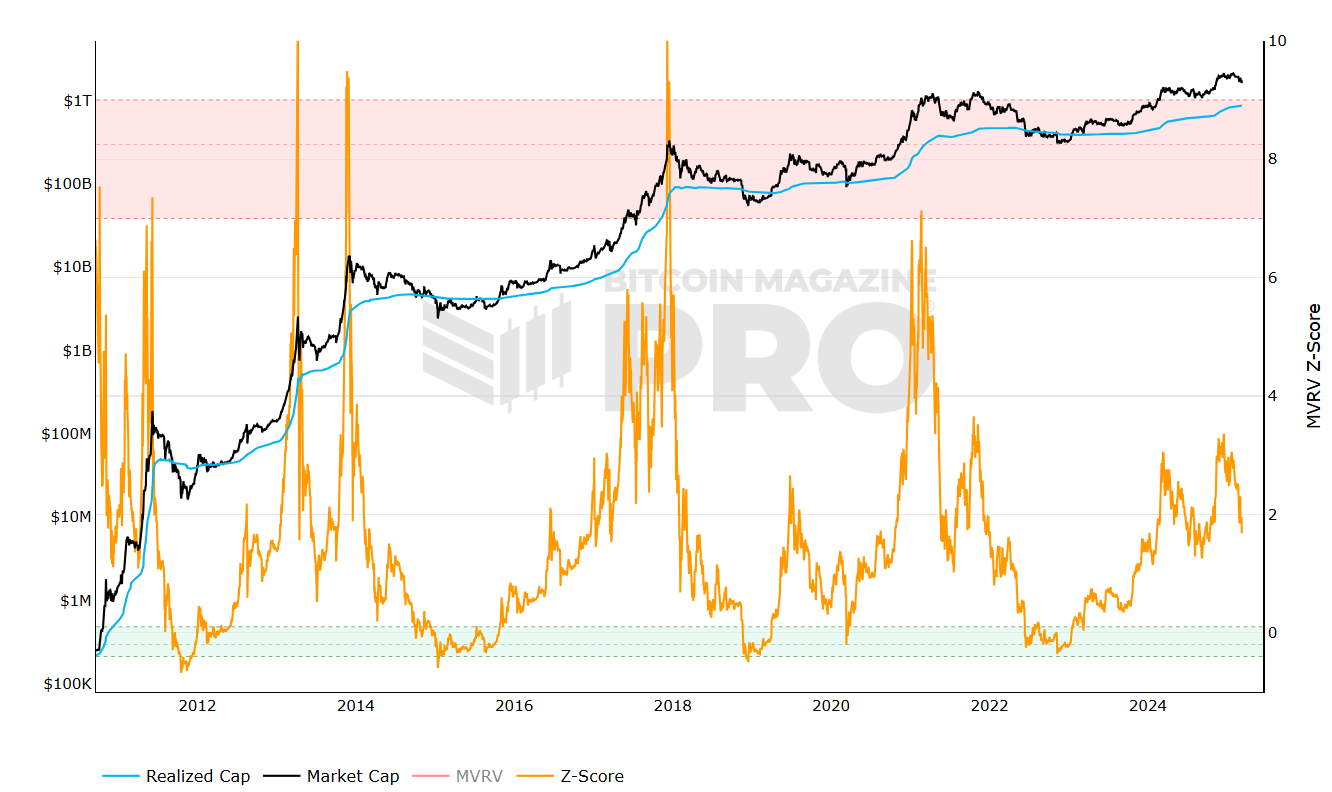
When it is lower than 4, it means the first phase – breakout. If it shows 4-7, the market is in the Banana Zone. While it's above 7, the market is overheated and will soon begin to cool down. So this is the right time to take profit.
For now, MVRV-Z Score is 2.85. So, according to MVRV-Z Score, we're at the beginning of a trend.
Strategies for Navigating the Bitcoin Banana Zone
There are separate Bitcoin trading strategies depending on the Banana chart stage you are in.
Entering
At this stage, the main trader's task is to accumulate cryptocurrencies. To know for sure that it is a breakthrough, watch for a gradual increase in the bottom, an increase in trading volume, and monitor entering the whales.
If you work with futures, setting stop loss and taking profit points is obligatory.
Profit taking
If you are already in the Banana Zone – it's time to monitor the best exit point.
Recognize this stage on such indicators as bearish divergencies in RSI and MACD. Fix your profits in parts. You can orient psychological levels – for example, $75 000, $100 000.
Exit
Every cooling stage is finishing sadly for someone from traders since liquidation touches everyone who was captivated with FOMO, or use over-leverage. How to avoid this? As we wrote above, look for divergences, watch for whale sales, and a decrease in purchases in general.
Let us give you two more Bitcoin investment tips:
- Be fearful when others are greedy, and greedy when others are fearful – Warren Buffett.
- Buy and sell Bitcoin gradually, not on all-in.
Aside from indicators, specific solid rules, and technical analysis, don't forget about crypto trading psychology. Don't give up on FOMO; always stick to risk management and follow the news. Check your presumptions with the indicators. Don't rely on luck, and don't expect easy money.
Risks and Opportunities in This Market Phase
For now, the Banana Zone is not finished. What is Pal, the founder of this theory, telling:
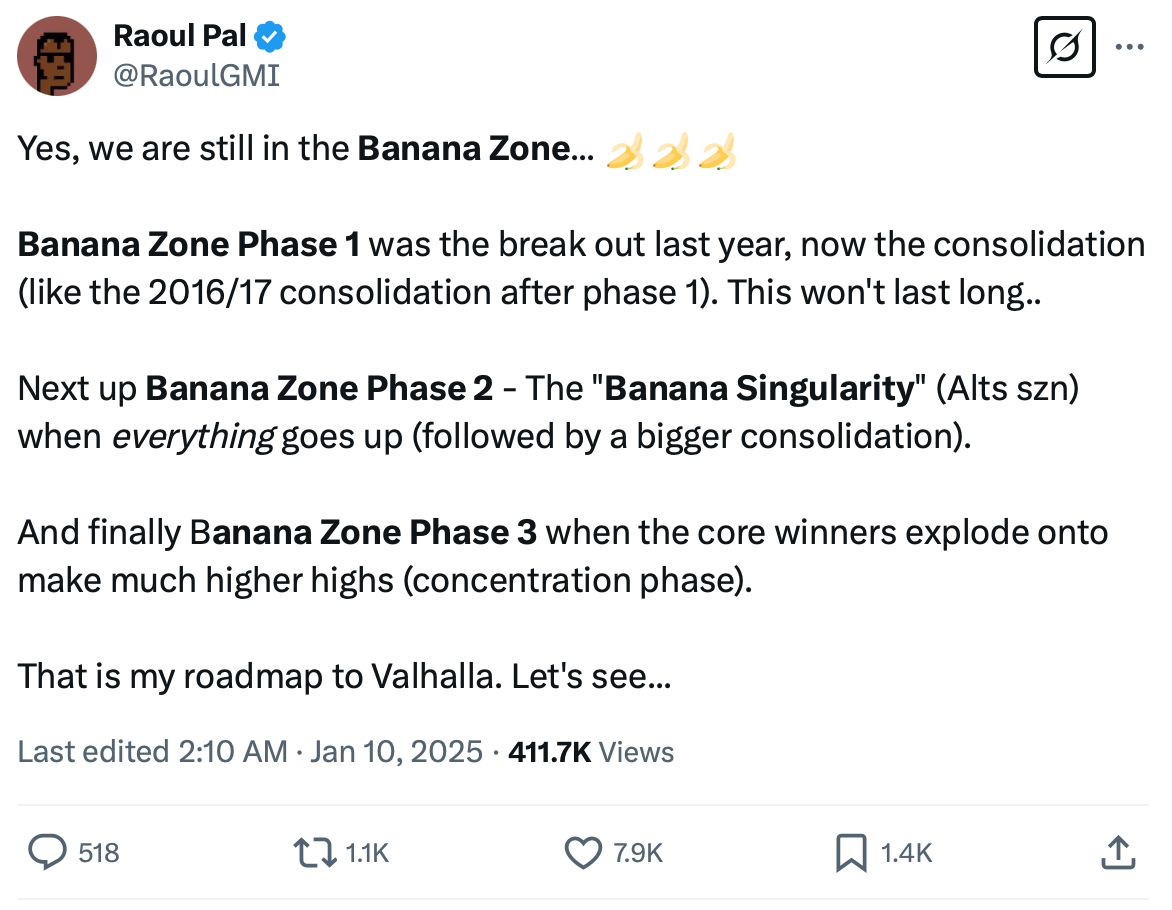
MVRV-Z score is only 2.85, as we saw earlier. Anthony Scaramucc, SkyBridge Capital founder, made his own impressive Bitcoin price predictions: "I think Bitcoin is a $200,000 asset this year."
However, the Banana Zone is not an indicator, so it can't help predict Bitcoin price movements for sure. We now see increased crypto market volatility that can lead to numerous liquidations. Be aware not to take risks too much.
 HODL Team
Disclaimer: All materials on this site are for informational purposes only. None of the material should be interpreted as investment advice. Please note that despite the nature of much of the material created and hosted on this website, HODL FM is not a financial reference resource and the opinions of authors and other contributors are their own and should not be taken as financial advice. If you require advice of this sort, HODL FM strongly recommends contacting a qualified industry professional.