

Bitcoin continued its decline this week, falling to as low as $82,000, and now trading around $82,474 at the time of writing. The world’s largest cryptocurrency has been steadily “walking its way down the liquidity staircase,” with the next major price step sitting near $85,000, according to technical mapping that focuses on liquidity clusters instead of traditional chart patterns.
That level, derived from horizontal grids of historical trading activity and order-book depth, marks a significant psychological and structural zone. These bands outline areas where traders often set stop-loss and take-profit orders, and over the past 18 months, Bitcoin has treated them as recurring pivot points.
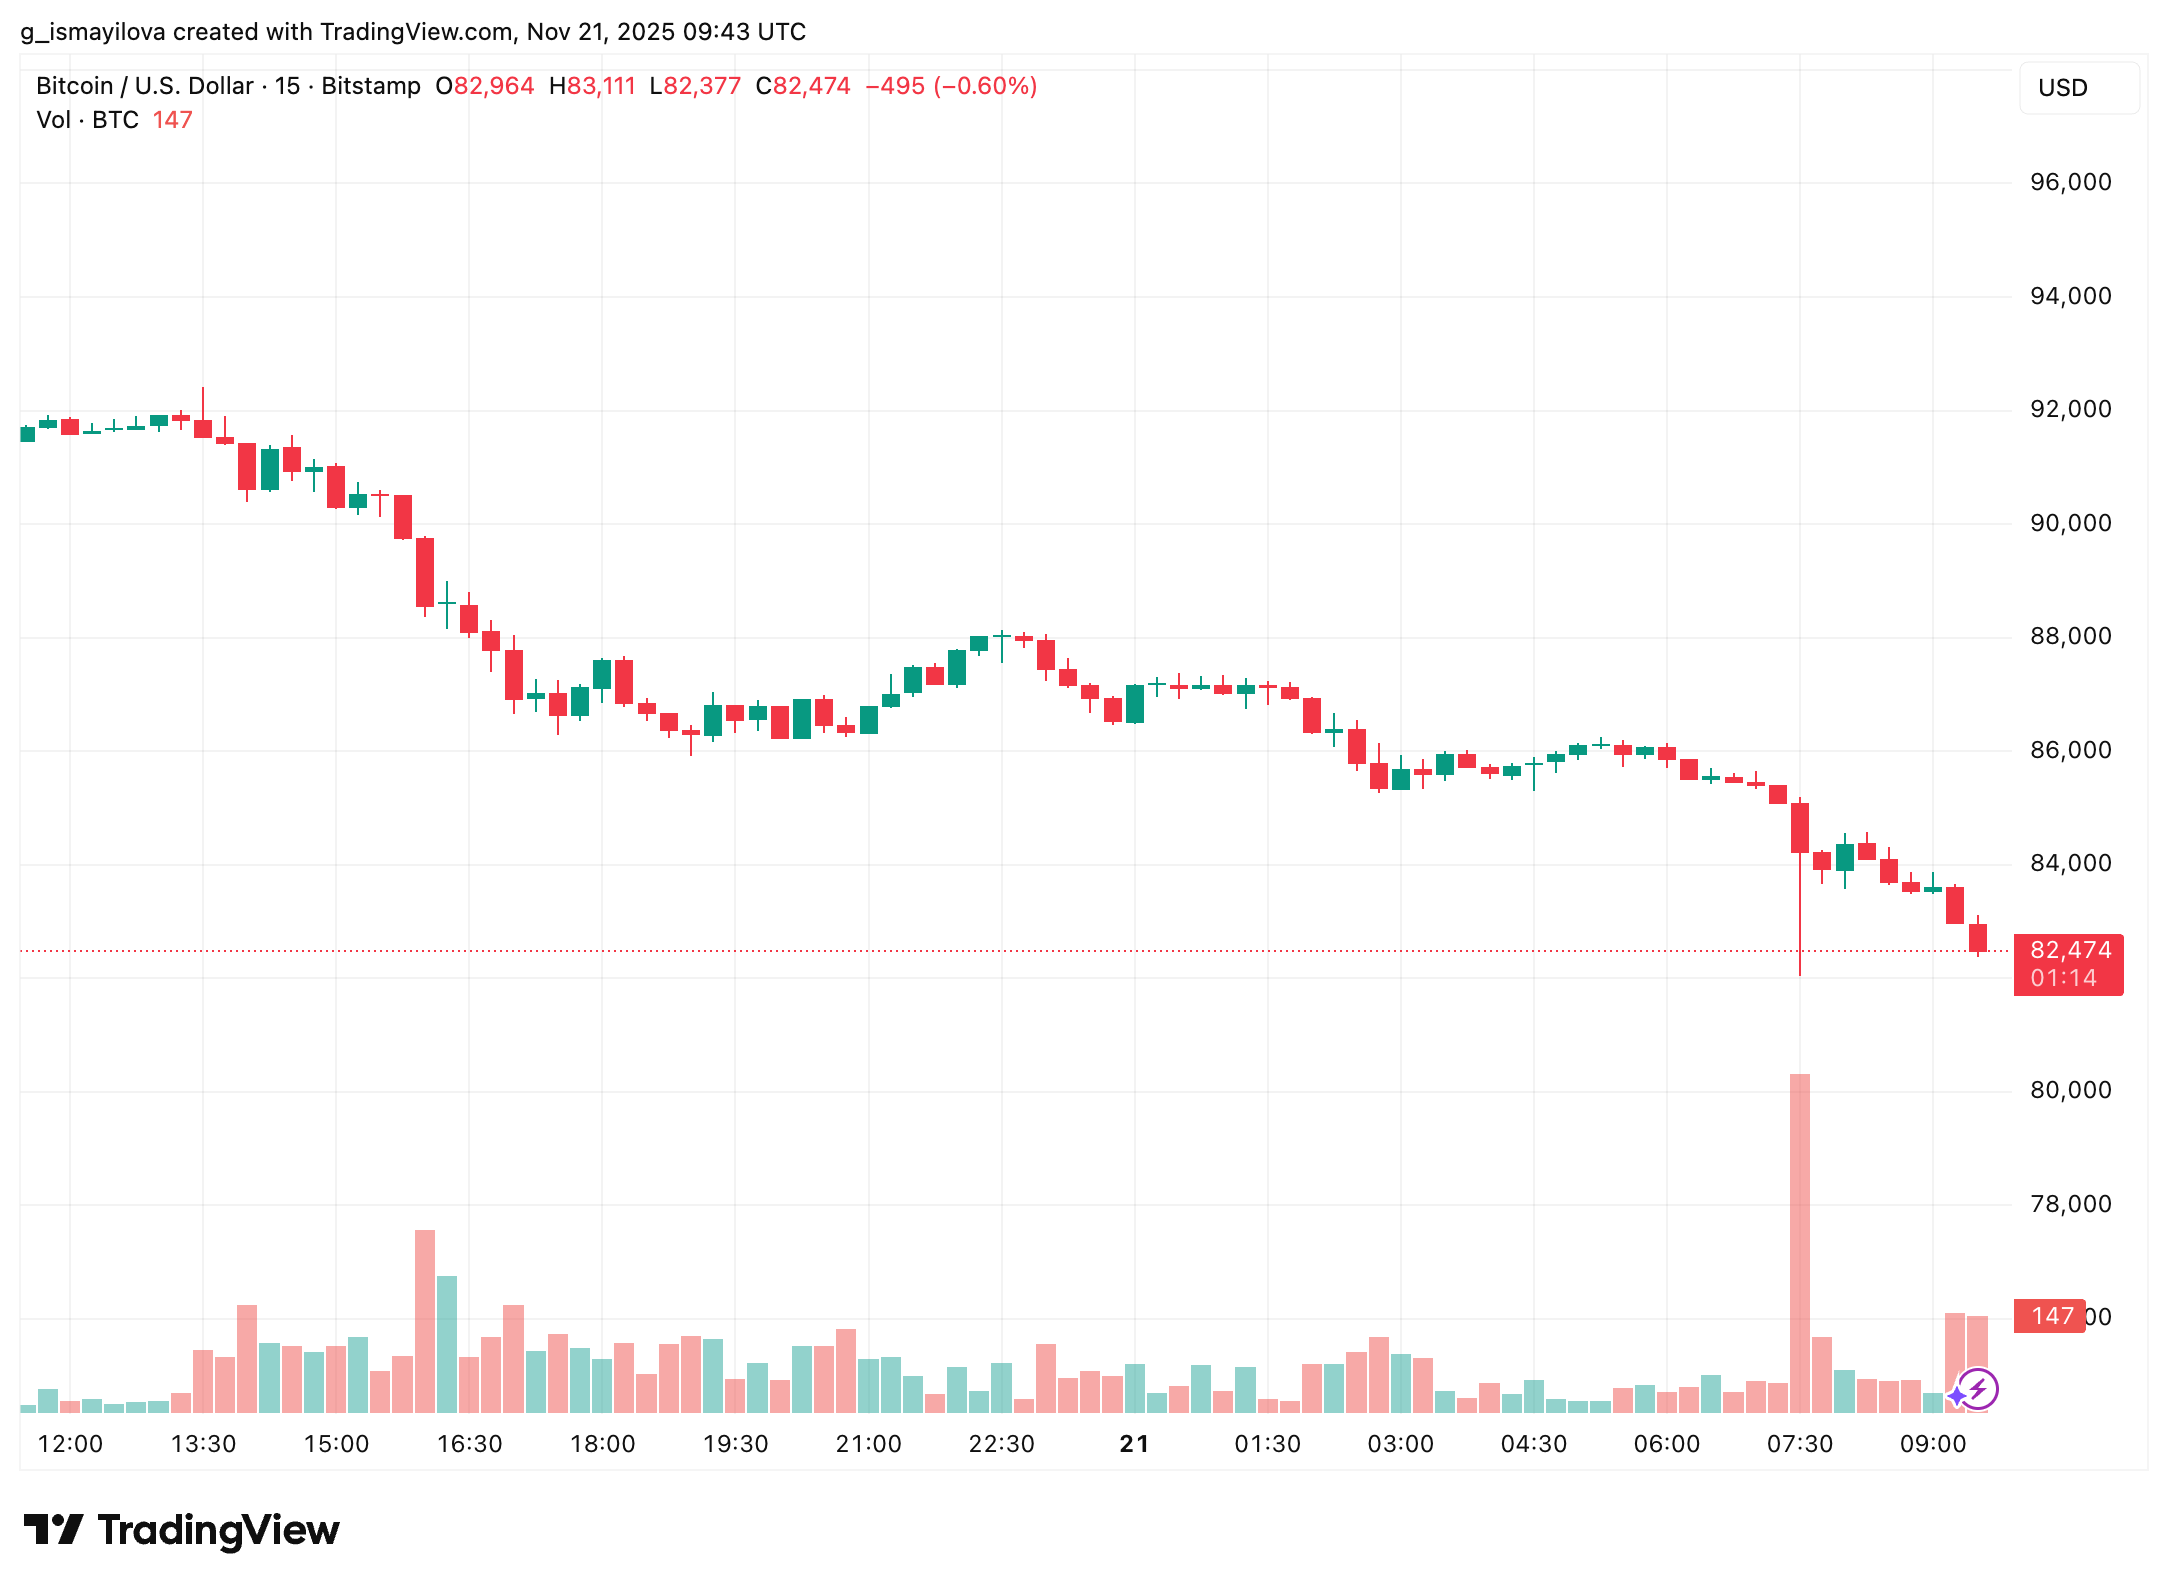
Shorter timeframes show that Bitcoin is still fluctuating around $80,000, especially on the 15-minute chart. The $80,000 mark is clearly the next deep pool of liquidity, while resistance around $92,000–$93,000 has turned into a ceiling.
ETF outflows mark a major sentiment shift
U.S. spot Bitcoin exchange-traded funds (ETFs) have also recorded significant outflows, deepening concerns over investor sentiment. Data from SoSoValue shows that the funds experienced a total daily net outflow of $903.11 million on Thursday, their second-largest single-day withdrawal since launching.
BlackRock’s iShares Bitcoin Trust (IBIT) led the exodus, shedding $355.5 million, followed by Grayscale’s GBTC at $199.35 million and Fidelity’s FBTC at $190.4 million. Several others, including products from Bitwise, Ark & 21Shares, VanEck, and Franklin Templeton, also saw capital leave.
“This a big sentiment shift from steady inflows earlier this month,” said Rachael Lucas, crypto analyst at BTC Markets. “And it’s not just crypto bleeding, Nvidia’s accounts receivable spike spooked equity markets, triggering a broader risk-off move. When tech giants wobble, liquidity tightens everywhere, and Bitcoin feels the pinch.”
Thursday’s outflow was the largest since late February, when renewed U.S. tariffs triggered a global sell-off.
Still, institutional exposure to Bitcoin remains substantial.
“Cumulative ETF inflows still sit at $57.4B, and total net assets are $113B, about 6.5% of Bitcoin’s market cap,” Lucas added. “Institutions haven’t abandoned ship; they’re just trimming sails. Extreme fear often precedes opportunity, but timing is everything.”
Macro data pressure builds as traders reassess the Fed
Fresh U.S. labor market data added to the selling momentum. The delayed non-farm payroll report for September revealed the economy added 119,000 jobs, more than double economists’ expectations of 50,000, according to The Guardian. The stronger-than-expected data dimmed hopes for a December Federal Reserve rate cut, sparking fears that liquidity could remain tight into year-end.
“BTC slipping below $85.5K comes as stronger-than-expected US jobs data dampens expectations for a December rate cut,” said Vincent Liu, CIO at Kronos Research. “Liquidity remains thin, and short-term profit-taking is amplifying the move. The market is recalibrating risk, reacting to macro data points.”
Analysts at CryptoQuant noted that uncertainty heading into December’s Federal Open Market Committee (FOMC) meeting could maintain pressure on risk assets. Rate-cut odds have fallen to 41.8%, and officials remain divided as inflation hovers near 3%.
If the Fed delays easing, liquidity may stay restricted, the same environment that accelerated Bitcoin’s sell-off earlier this month. However, stablecoin reserves on exchanges have reached a record $72 billion, historically a sign that capital is waiting on the sidelines for the next accumulation phase.
Analysts weigh Bitcoin’s next moves
Despite the current weakness, some researchers highlight levels where capitulation could mark the end of this correction. André Dragosch, head of research for Bitwise Europe, said Bitcoin’s “max pain” zone sits between $84,000, BlackRock’s estimated ETF cost basis, and $73,000, the cost basis for MicroStrategy.
FWIW —
— André Dragosch, PhD⚡ (@Andre_Dragosch) November 19, 2025
Think max max pain is reached the moment we tag either the IBIT cost basis at 84k or MSTR cost basis at 73k.
Very likely we’ll see a final bottom somewhere in between.
But these will be fire sale prices and akin to a full cycle reset imo.
“Those prices represent fire-sale levels that could reset market positioning,” Dragosch noted, arguing that a cycle bottom may ultimately form somewhere in that range.
Meanwhile, several short-term observers point to $85,000 as the immediate level to watch. The liquidity-grid analysis identifies that region as the densest cluster of historical orders since the launch of U.S. spot Bitcoin ETFs. A drop below it could expose the next shelf between the mid–$80,000s and high–$70,000s.
A market defined by fear, liquidity, and patience
Market mood remains deeply bearish, with the Crypto Fear & Greed Index hovering in “extreme fear” territory. The broader digital asset market is down more than 6% in the past 24 hours, paralleling declines in equities as the S&P 500 fell 1.56% and the Nasdaq Composite slipped 2.15%.
Bitcoin’s multi-week slide reflects not only macro stress but also a systematic liquidity migration, one that has brought price lower step by step. For now, $85,000 remains the critical short-term line, while longer-term buyers appear to be eyeing deeper supports near $73,000.
Bitcoin’s next move, as one analyst put it, is less about prophecy and more about following the liquidity map: a story already written in the market’s own footprints.

Disclaimer: All materials on this site are for informational purposes only. None of the material should be interpreted as investment advice. Please note that despite the nature of much of the material created and hosted on this website, HODL FM is not a financial reference resource, and the opinions of authors and other contributors are their own and should not be taken as financial advice. If you require advice. HODL FM strongly recommends contacting a qualified industry professional.