

Welcome to another week of Bitcoin on the HODL.FM, a fun Web3 publication that curates reliable insights for traders, degens, builders and investors.
More: Bitcoin Hodlers Accumulated $23B in the Previous 30 days
Here is what happened to Bitcoin this week:
- Bitcoin price change: BTC increased by 3.22% over the last seven days from $58,866 to $60,752, as per CoinMarketCap data.
- Market capitalization: Bitcoin’s market cap went up from $1.16 trillion to $1.20 trillion over the last seven days after posting a 2.94% increase.
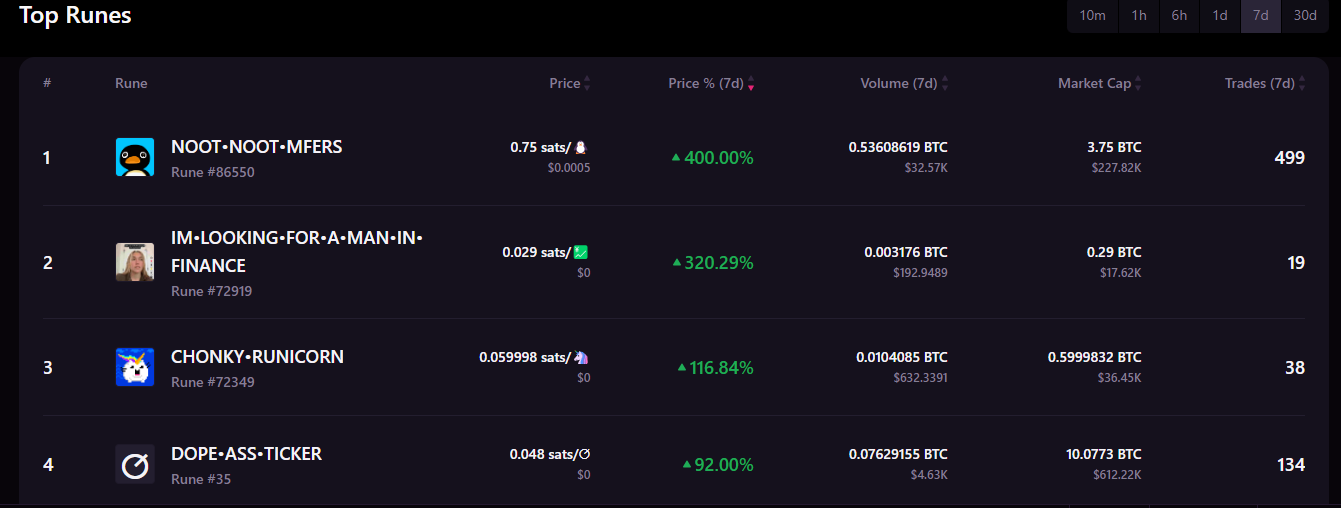
- Top performing Bitcoin altcoins: NOOT•NOOT•MFERS, IM•LOOKING•FOR•A•MAN•IN•FINANCE and CHONKY•RUNICORN led the Bitcoin Runes ecosystem on Magic Eden Marketplace with 400%, 320.19% and 116.84%, respectively, over the last 7-days.
Bitcoin reached for the stars on August 20, aiming for weekly highs as it flirted with the $61,000 mark, sparking fresh optimism for a BTC price revival.
A sense of caution has however dominated the scene as the price has remained stuck in a downward-sloping range for the last 3 weeks, struggling to break through the critical resistance level near $70,000.
Bulls see this as Bitcoin’s way of making a choice between taking the next big leap or keeping traders on the edge of their seats a little longer.
Meanwhile, before we delve into the technical and onchain insights of Bitcoin price, let’s quickly dive into the Runes ecosystem.
The Bitcoin Runes Ecosystem Made 70.52% of all BTC Transactions on Sunday
On August 18, Runes transactions took center stage, making up a whopping 70.52% of all Bitcoin transactions—a noticeable jump from their usual 40%-70% range over the past month.
Yet, in a twist of fate, the Runes Marketplace experienced its quietest day ever, with a mere $907,000 in transaction volume—the lowest since Runes made its debut. It's a bit like throwing the biggest party in town, only to find that everyone left early.
Here are the top Runes over the Week:
3-Weeks Bitcoin Price Range Prevails
Bitcoin has been doing its best impression of a yo-yo, bouncing between the 50-day SMA at $61,425 and the $55,724 support level for the past few days.
It's like it's testing our patience with one oscillation at a time.
Bitcoin Technical Analysis: Bulls Eyeing to Break $61,000
The downsloping 20-day EMA at $59,908 and an RSI flirting with the wrong side of the midpoint suggest the bears have a slight edge. If the bulls want to flip the script, they’ll need to push the price above the 50-day SMA.
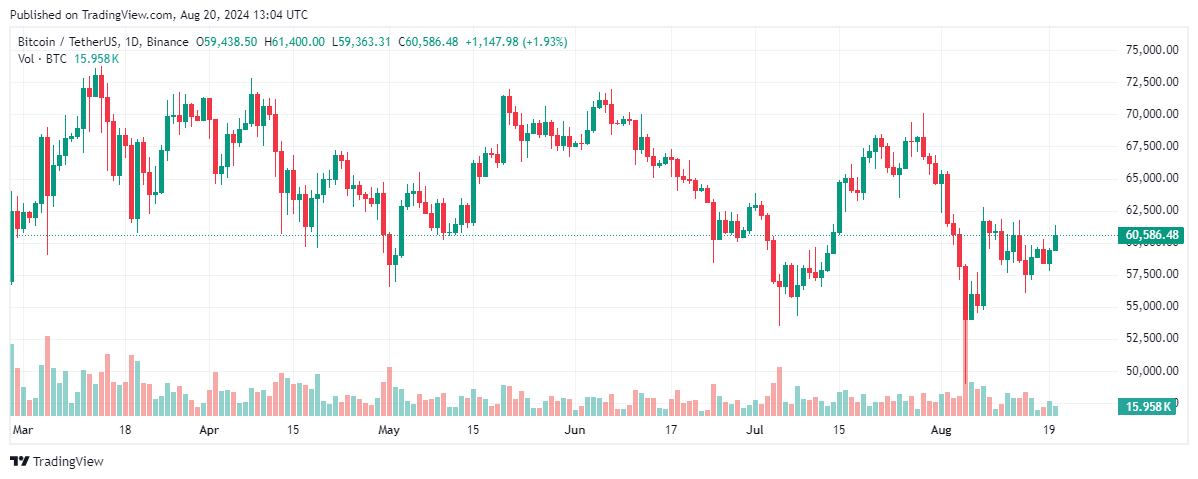
Should they pull that off, we could see the BTC/USDT pair take a victory lap to $65,660 and then on to $70,000. To do this, the bulls certainly need a good pair of running shoes!
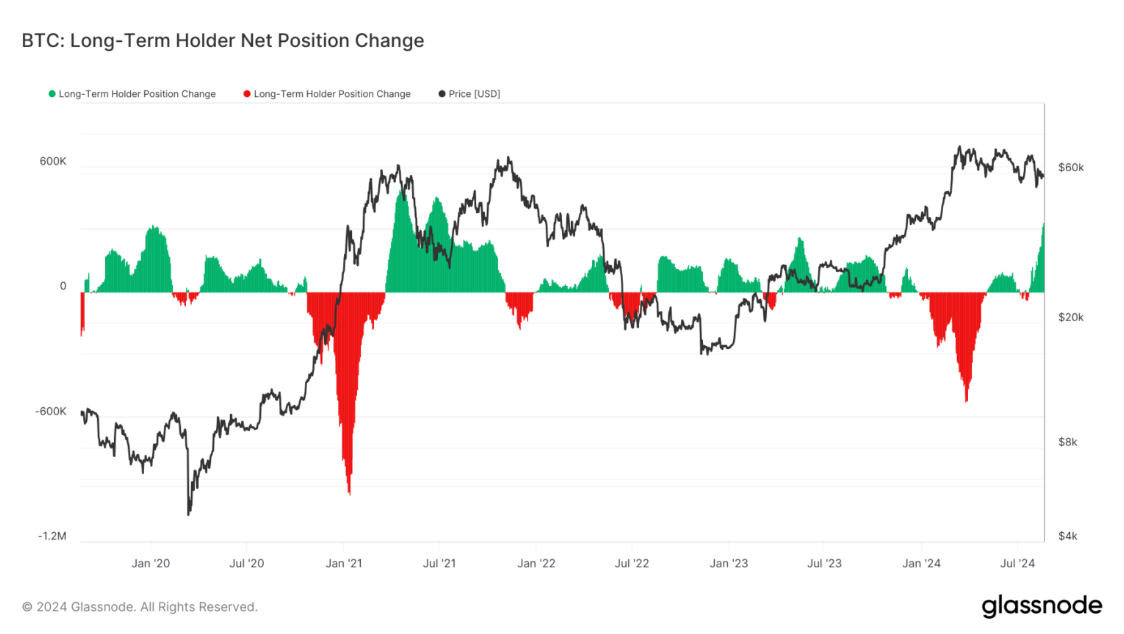
Bitcoin Onchain Analysis: Long-term Hodlers Bought 334,358 BTC Today
Insights from Glassnode indicate Bitcoin’s long-term holders have been quietly filling their bags since July 22, with their net position change on a steady rise.
But today, things got interesting—this metric, which tracks the 30-day change in supply held by these patient investors, just hit its highest level since January 2020.
Apparently, the long-term HODLers who read HODL FM are quickly leaning into the HODL philosophy!
In 2020, the last time long-term holders piled up this much Bitcoin,the price was $10,300. Fast forward to the end of that year, and the value had skyrocketed to $28,988—a jaw-dropping 300% increase.
If history likes to repeat itself, we might be in for quite the ride!
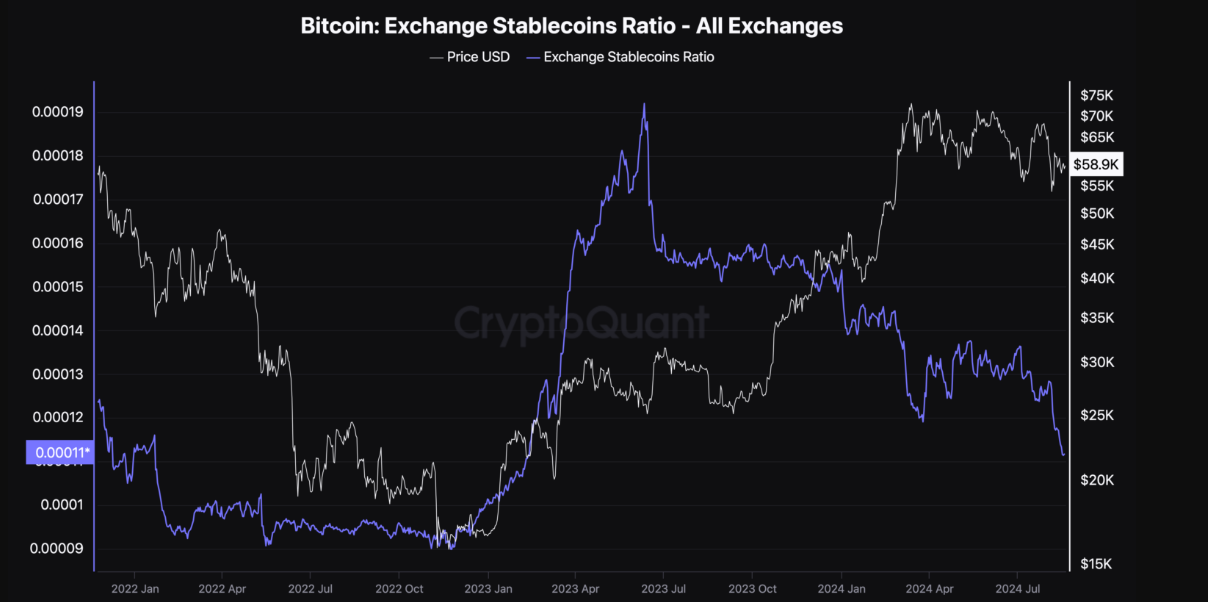
Bitcoin’s Exchange Stablecoin Ratio
Another telling sign is the Exchange Stablecoin Ratio, a metric that measures the market's buying power. When this ratio is high, it signals low buying power, which often points to a higher risk of a price drop.
But here’s the kicker: as of now, Bitcoin’s Exchange Stablecoin Ratio is at its lowest since February 2023. This drop hints that market participants are sitting on a hefty pile of buying power, ready to fuel a potential price surge. Looks like the bulls might be gearing up for a shopping spree!
What is NEXT?
From a technical perspective, Bitcoin is currently hanging out below the 200-day Exponential Moving Average (EMA), a key indicator that usually hints at the trend direction. With BTC trading under this line, the short-term outlook is leaning bearish.
But here’s the catch: if we see a quick price bump that nudges Bitcoin above the 200 EMA (that purple line), the bulls could seize the moment and drive the price higher. If they manage to pull it off, we might see Bitcoin making a run for $61,000.
Well It’s a classic case of “stay tuned to HODL FM; things could get interesting!”

Disclaimer: All materials on this site are for informational purposes only. None of the material should be interpreted as investment advice. Please note that despite the nature of much of the material created and hosted on this website, HODL FM is not a financial reference resource and the opinions of authors and other contributors are their own and should not be taken as financial advice. If you require advice of this sort, HODL FM strongly recommends contacting a qualified industry professional.