

Bitcoin made a big jump, going up more than 8.5% in the last week and reaching a new all-time high of $124,128 on Thursday. But don't open the champagne yet! The price of Bitcoin, the king of crypto, went down a little to $121,800. However, it is still up 32% since January and 62% from its lowest point this year. I mean, who would have thought this would happen?

What is causing this rise? Well, a few things. The first thing that happened was that the U.S. released its July CPI report. Inflation stayed at 2.7%, which was the same as in June and lower than the expected 2.8%. Also, the overall cost of living only went up by 0.2% from one month to the next, which is a little better than the 0.3% rise in June. I think these numbers helped keep the market positive.
The CME FedWatch tool shows what the market thinks will happen with Fed interest rates. After the CPI came out, the chances of a rate cut at the September meeting went up to 95.8%. When rates go down, it costs less to borrow money, there is more money available, and people are more willing to take risks with assets like cryptocurrencies. So, of course, Bitcoin did really well.
Bitcoin ETF Inflows Make People Feel Good
But here's where it gets interesting: new money coming into spot Bitcoin and Ethereum ETFs is also helping to push Bitcoin's price to an all-time high. SoSoValue says that the 12 spot BTC ETFs had net inflows of more than $1 billion over the last five trading days. Ethereum also got in on the action, bringing in about $1 billion on Tuesday alone. This influx of money is clearly making people feel better about the market, and I think we're in for a good ride.
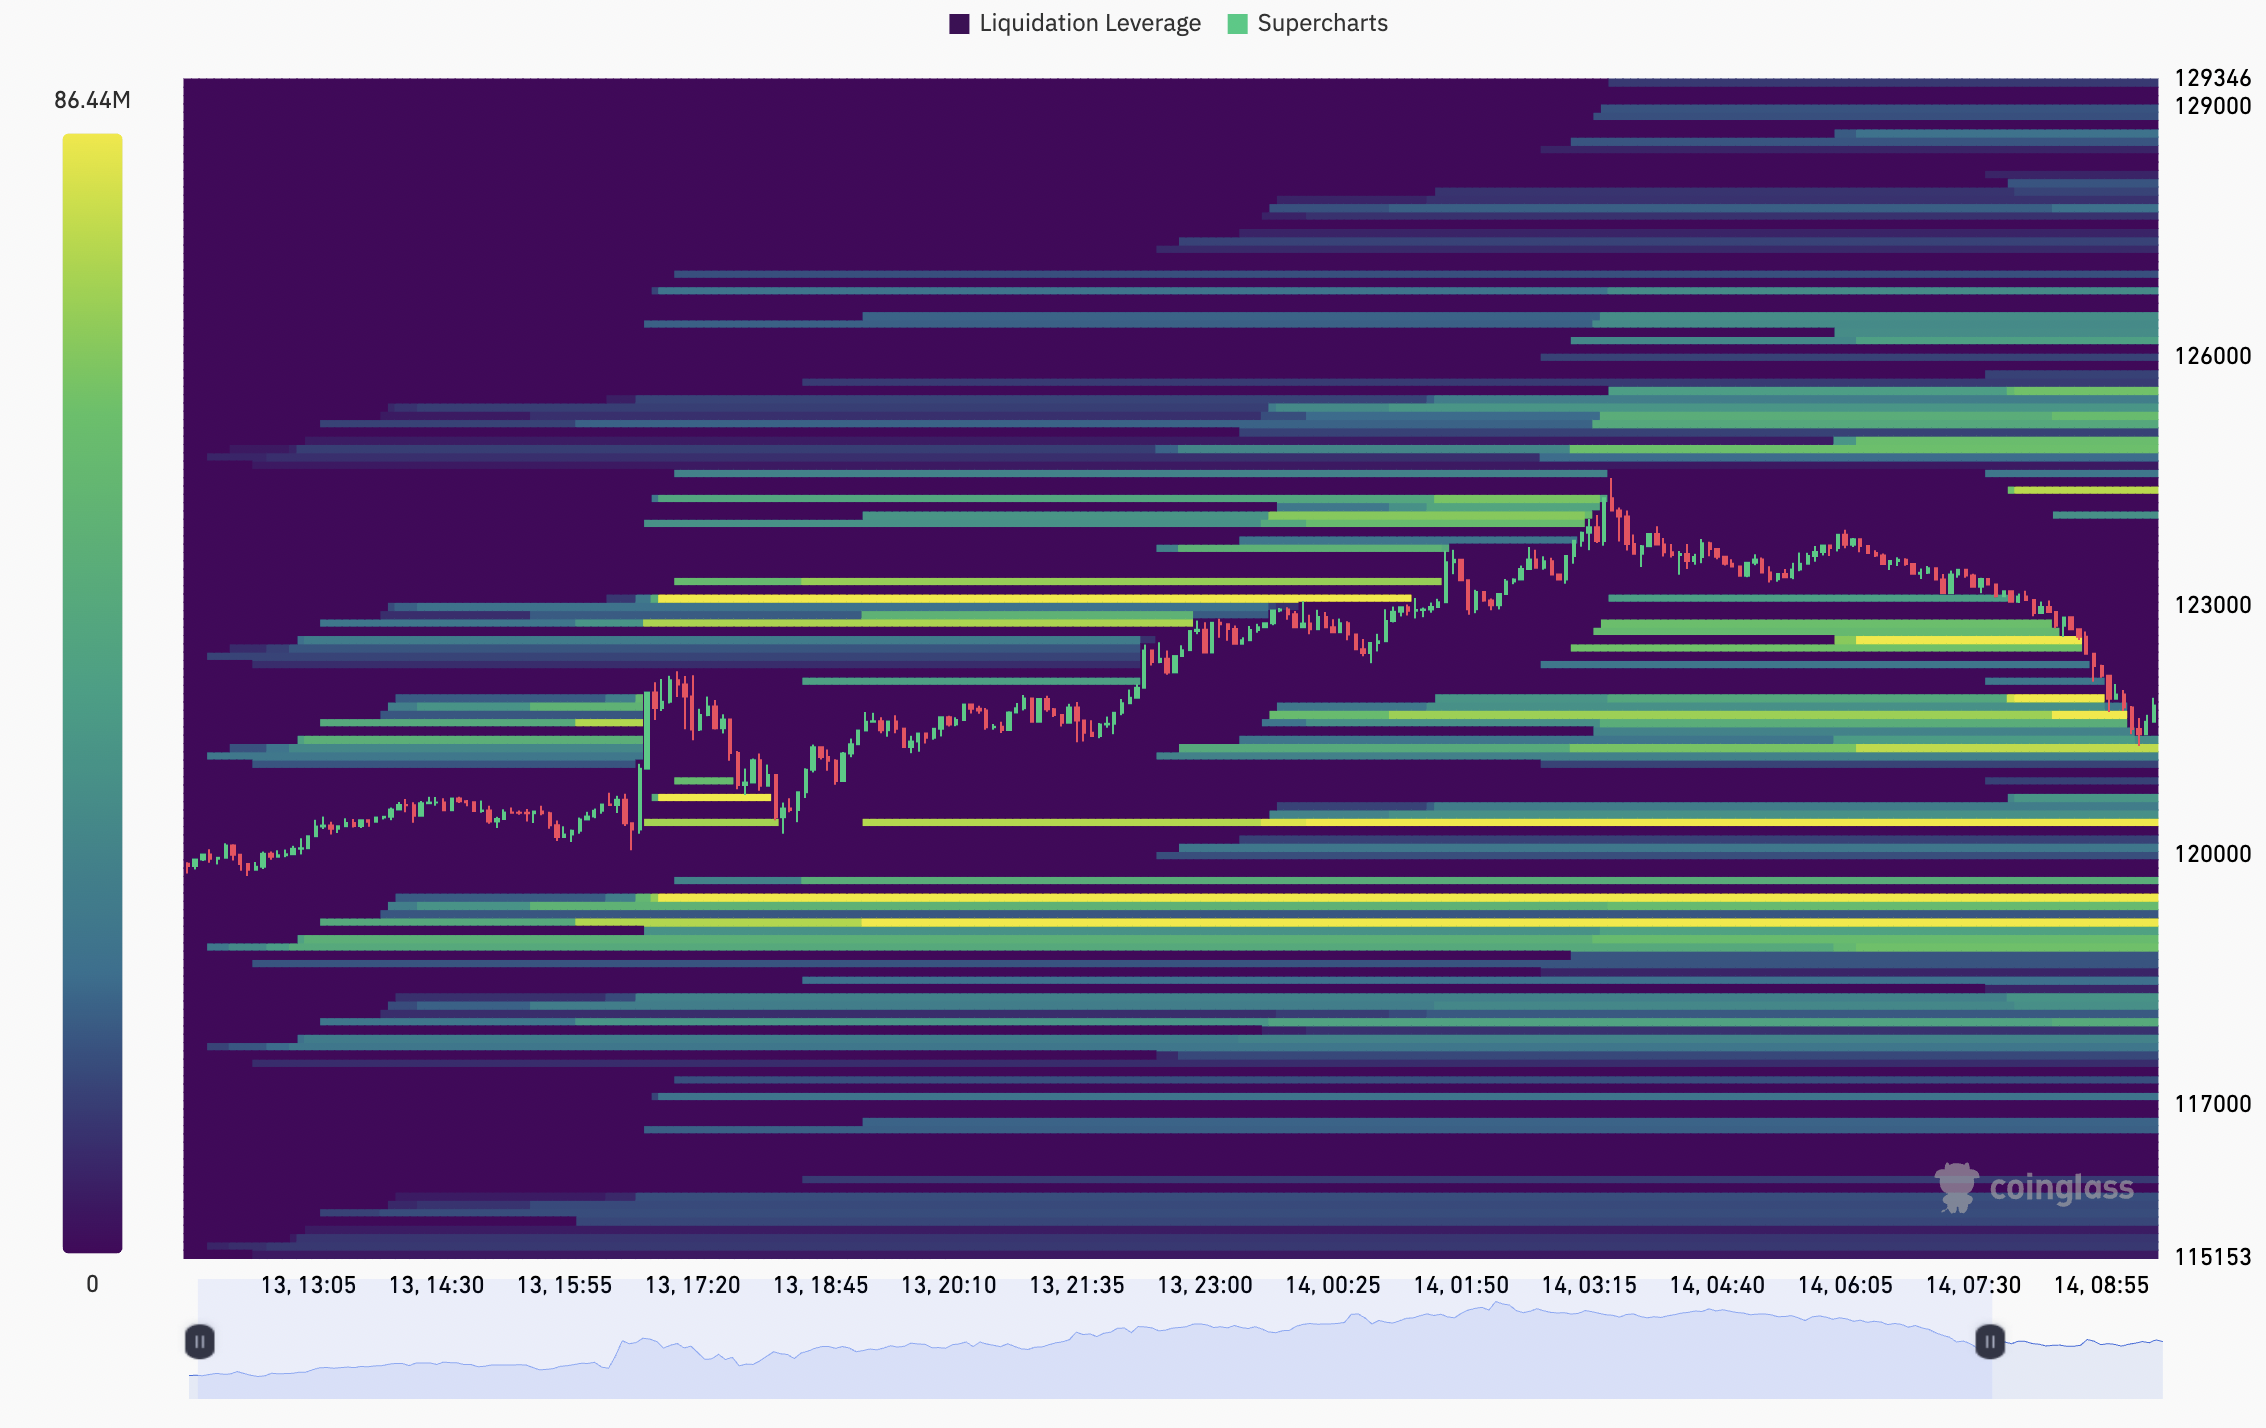
When we look at Bitcoin's price movements, we can see that the recent rise to new highs was followed by short liquidations, especially in the $124,000–$126,000 range. This made a lot of traders who were betting against the price close their positions, which helped the rally. But there's always a catch. The CoinGlass BTC liquidation heatmap shows that if Bitcoin goes back down to the $120,000–$121,000 range, it could cause a lot of people to sell, which could make the price go down even more. Isn't it fun?
The Price Action of BTC and What Comes Next
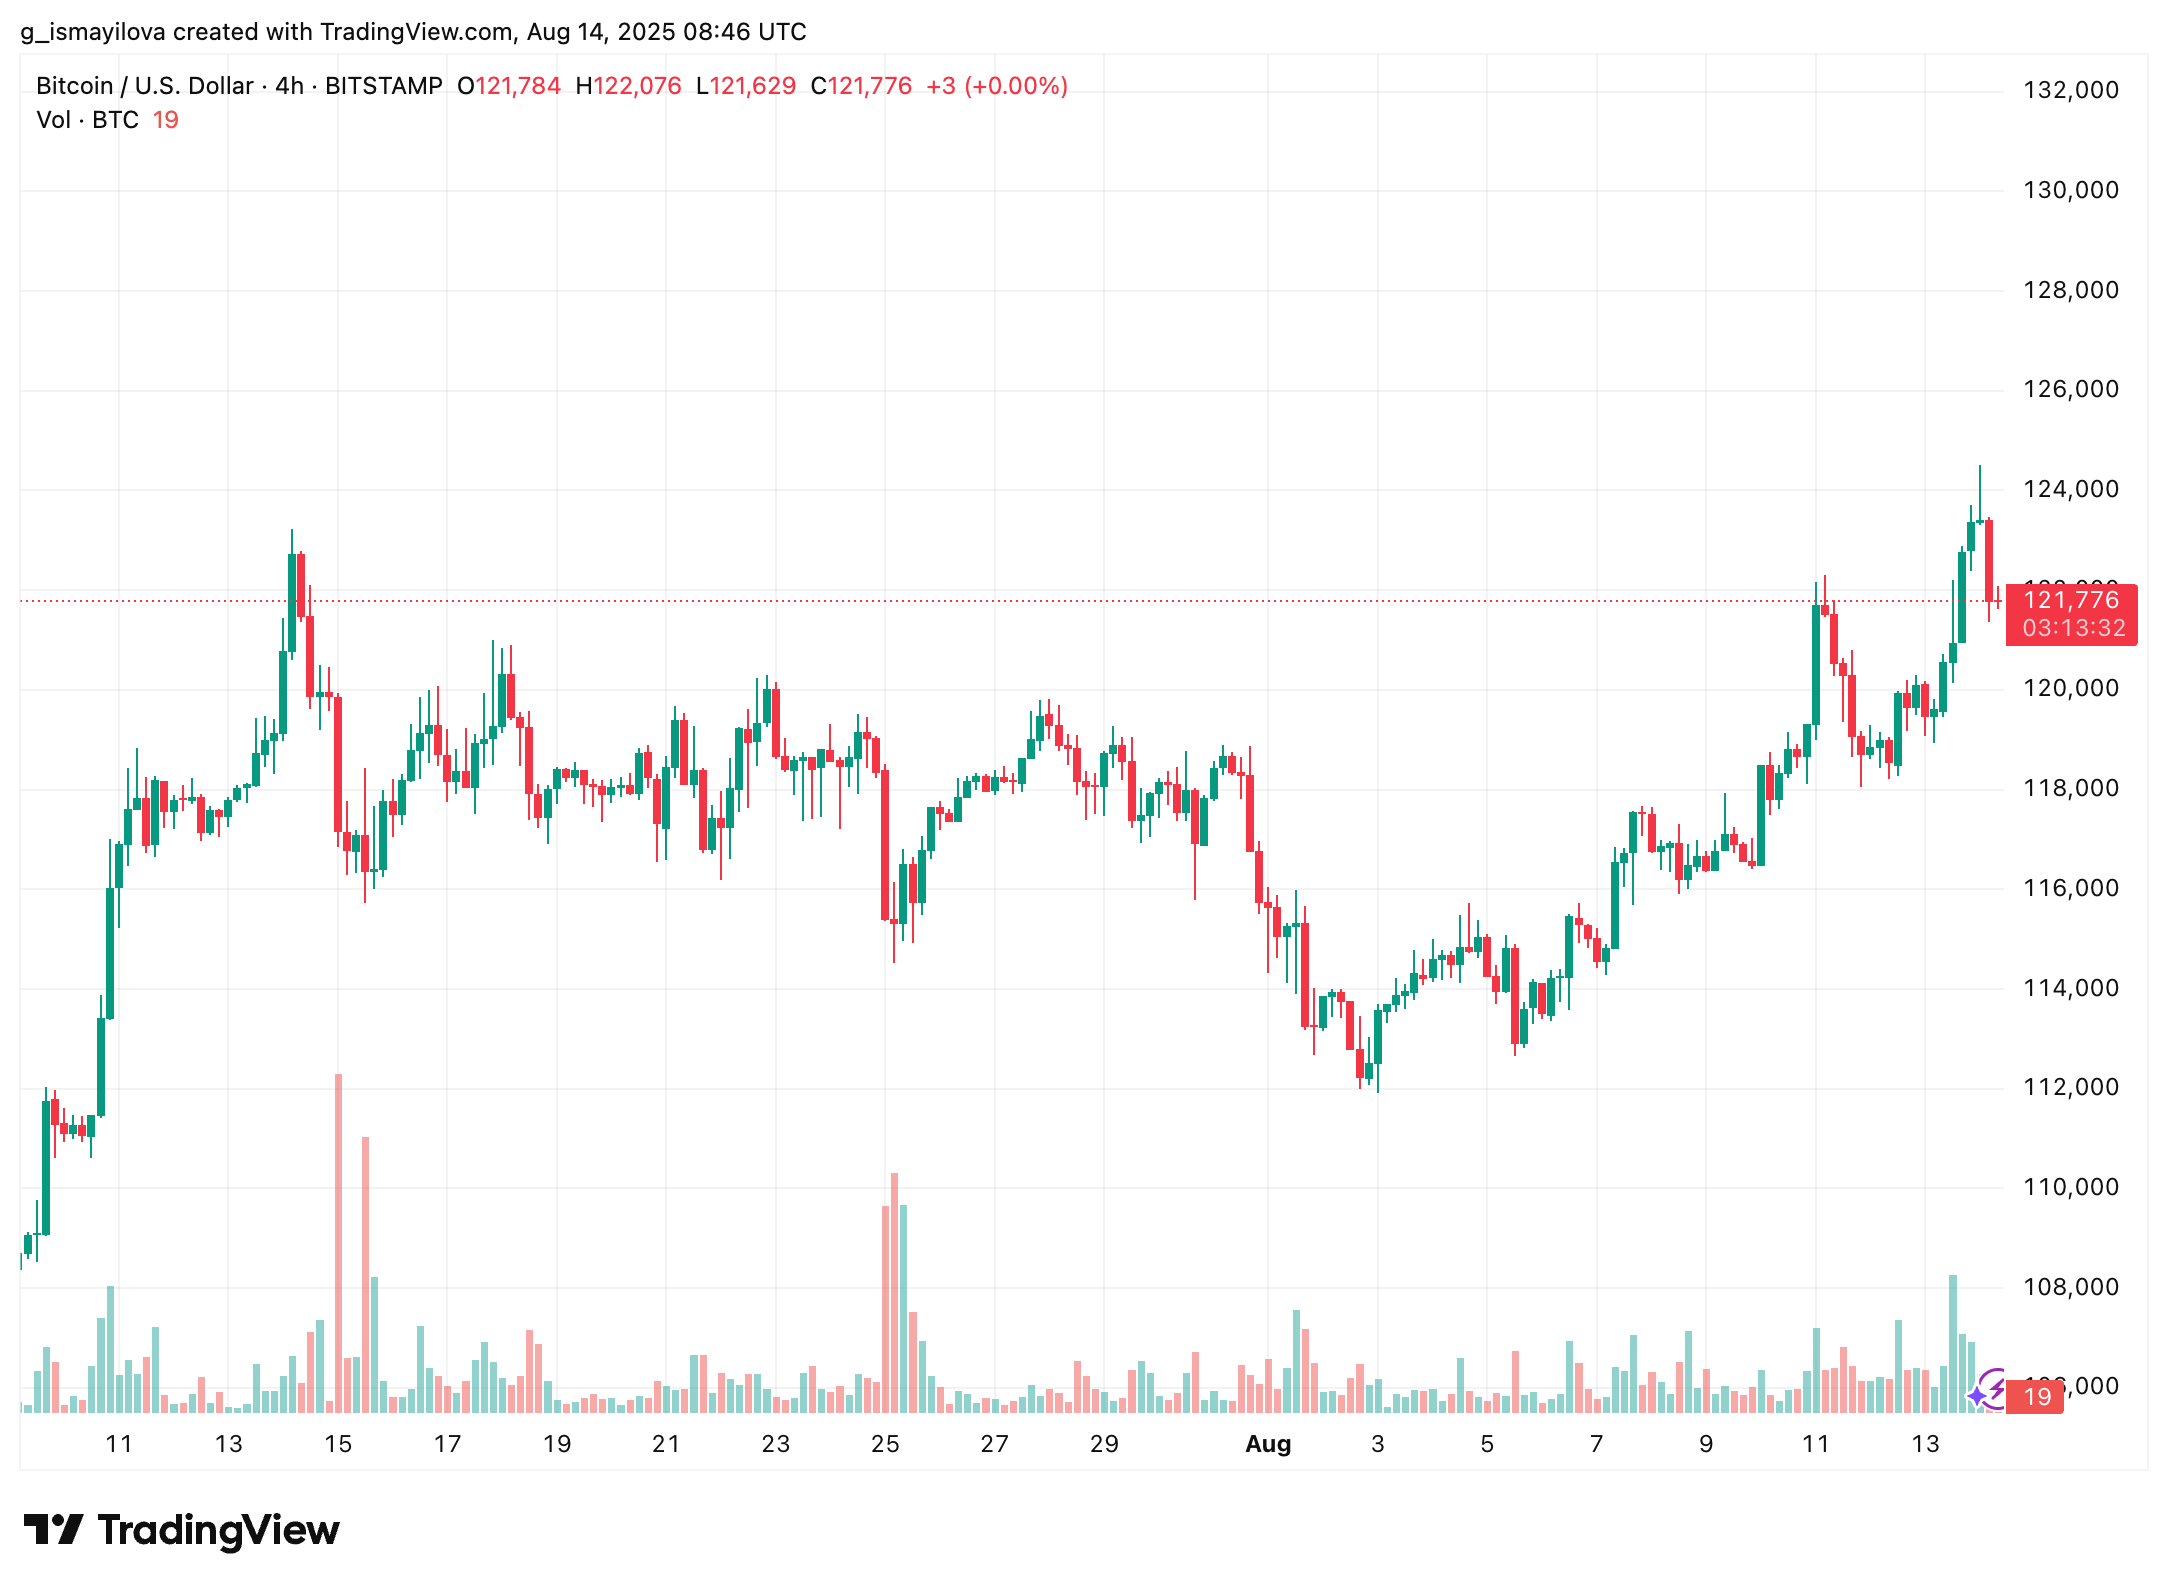
The 4-hour chart shows that Bitcoin is clearly going up, with an ascending parallel channel pattern. The price is going down after touching the top of the channel, and it might go up to around $120,500 by the end of the current session. I'm thinking that Bitcoin could go back up to $127,000 in the next part of this rally if it stays strong at this level. It's like riding a roller coaster: exciting but hard to predict.
The 50-day moving average just crossed above the 200-day moving average, which adds to the bullish mood. Bitcoin doesn't seem to be done going up yet.

Disclaimer: All materials on this site are for informational purposes only. None of the material should be interpreted as investment advice. Please note that despite the nature of much of the material created and hosted on this website, HODL FM is not a financial reference resource, and the opinions of authors and other contributors are their own and should not be taken as financial advice. If you require advice. HODL FM strongly recommends contacting a qualified industry professional.